
Germany ZEW Survey - Economic Sentiment turns positive 10.5 in June: What it means for EUR/USD?

German ZEW Survey - Economic Sentiment turns positive to 10.5 in June after remaining negative in May. The data was expected to come in better at -6.0 from the previous reading of -10.2.
The ZEW Survey - Current Situation unexpectedly deteriorates to -81.0 from the previous reading of -77.8. It was expected to improve slightly to -77.5.
In the Eurozone, the ZEW Survey - Economic Sentiment also turns positive. The sentiment data has arrived at 9.5, better than -7.2 estimates, and the prior release of -9.1.
There has been no immediate response observed in the Euro (EUR), following the German data release. However, EUR/USD has gained significantly in the European trade as the peace deal signing between the United States (US) and Iran has diminished the US Dollar’s safe-haven demand.
What does significant improvement in Germany/Eurozone ZEW Survey - Economic Sentiment data means for EUR/USD?
The Germany/Eurozone ZEW Survey - Economic Sentiment reflects the sentiment of institutional investors towards the economy. The data shows the difference between the share of investors who are optimistic and the share of analysts who are pessimistic.
Generally, better-than-projected sentiment data improves the appeal of the EUR/USD, while soft figures weigh on the same.
The impact of the data has remained significant in the past few months due to Middle East conflicts, which prompted energy prices and increased pressure on households’ spending.
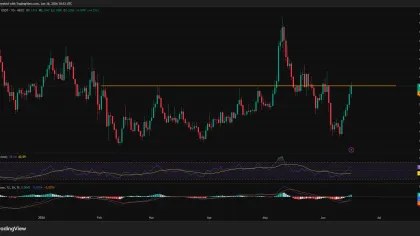
Technical Analysis: EUR/USD remains inside Symmetrical Triangle formation
EUR/USD trades 0.1% higher at around 1.1603 at press time. The pair holds just above the 20-day exponential moving average (EMA) at 1.1602, which lends modest near-term support, but it remains well below the descending trend-line barrier drawn from 1.1849, keeping the broader tone capped.
The Relative Strength Index (14) at 48 sits near neutral territory, hinting at a lack of clear momentum while price consolidates between supportive short-term averages and the still-dominant downward trend structure.
On the topside, initial resistance is seen at the downtrend break level near 1.1687, with the descending trend line from 1.1849 reinforcing a higher resistance zone. On the downside, the former uptrend break area around 1.1506 is the major support zone ahead of stronger structural support near the original rising trend-line anchor at 1.1409.
(The technical analysis of this story was written with the help of an AI tool.)
Disclaimer: The content of this article solely reflects the author's opinion and does not represent the platform in any capacity. This article is not intended to serve as a reference for making investment decisions.
You may also like
Altcoin Season News: Why Next Six Months Are Important

Pundit to Every XRP Holder Feeling Worn Down By the Price
Jupiter price jumps 40% as bulls challenge key resistance near $0.20
BMNR Is Down 45% This Year, Yet Options Traders Favor It Over MSTR