- Whale inflows and weak holder growth increase selling pressure across Shiba Inu market.
- SHIB trades inside a descending wedge pattern, signaling continued bearish technical structure.
- Resistance rejection and weak demand raise risk of further downside toward lower support.
Shiba Inu enters a difficult phase as fresh on chain activity and technical weakness align across multiple indicators. Large holders continue moving tokens onto exchanges while ecosystem growth slows noticeably. At the same time, price structure remains trapped inside a long descending wedge that favors sellers. Traders now watch whether SHIB can stabilize or extend losses further. Current conditions suggest pressure is building rather than fading, keeping market attention firmly on downside risk scenarios ahead.
Whale Activity and Weak Growth Pressure Market Sentiment
Recent blockchain data shows more than four billion SHIB tokens moved onto exchanges within a single day. Analysts link this shift to large holders adjusting positions during a fragile recovery phase. Exchange inflows often signal preparation for selling, especially during uncertain market conditions. That pattern becomes more relevant when price action already struggles below key resistance zones.
Additional supply entering exchanges increases pressure on buyers trying to defend support levels. Even modest selling activity can slow recovery attempts. At the same time, wallet growth shows limited momentum. Total holder count sits near 1.6 million addresses. Recent expansion added fewer than two thousand new participants over two weeks. That pace signals cooling interest compared to earlier cycles.
Strong ecosystems usually rely on consistent new inflows of users. Slower growth often reduces demand support during downturn phases. Existing holders now play a larger role in price direction. When inflows weaken and activity shifts toward exchanges, recovery strength often fades. Market structure currently reflects that imbalance across short-term charts.
SHIB Price Structure Still Signals Downside Risk
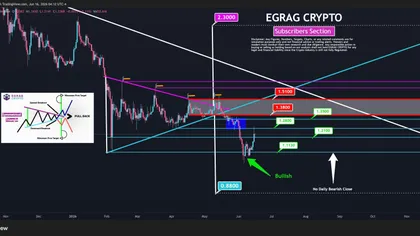
The chart pattern continues to define the broader outlook. SHIB trades inside a descending wedge that has controlled movement for months. This structure often appears during extended consolidation phases within bearish trends. Price currently sits near $0.00000499 after a steep yearly decline of nearly 50%. Sellers continue to dominate rebounds near resistance zones. Buyers have yet to produce a strong breakout signal.
Technical levels highlight ongoing pressure. First resistance appears near $0.0000055, followed by a stronger barrier around $0.0000067. Until price clears those zones, upside momentum remains limited. Downside risk remains part of the current setup. If weakness continues, price could drift toward the lower boundary of the wedge. That move would represent another drop of roughly 20% from current levels.
Volume behavior also supports cautious positioning. Buying interest remains inconsistent across recent sessions. That lack of conviction prevents trend reversal confirmation. A breakout above resistance would change sentiment quickly. Strong movement beyond $0.0000067 could shift attention back toward recovery scenarios. Until then, sellers maintain structural advantage across the chart.