Bitcoin trades at $65,581 on June 17, holding above the 0.5 Fibonacci level at $66,782 as spot ETFs recorded their third inflow day this month and three of the most respected research teams in crypto published conflicting bottom calls on the same week.
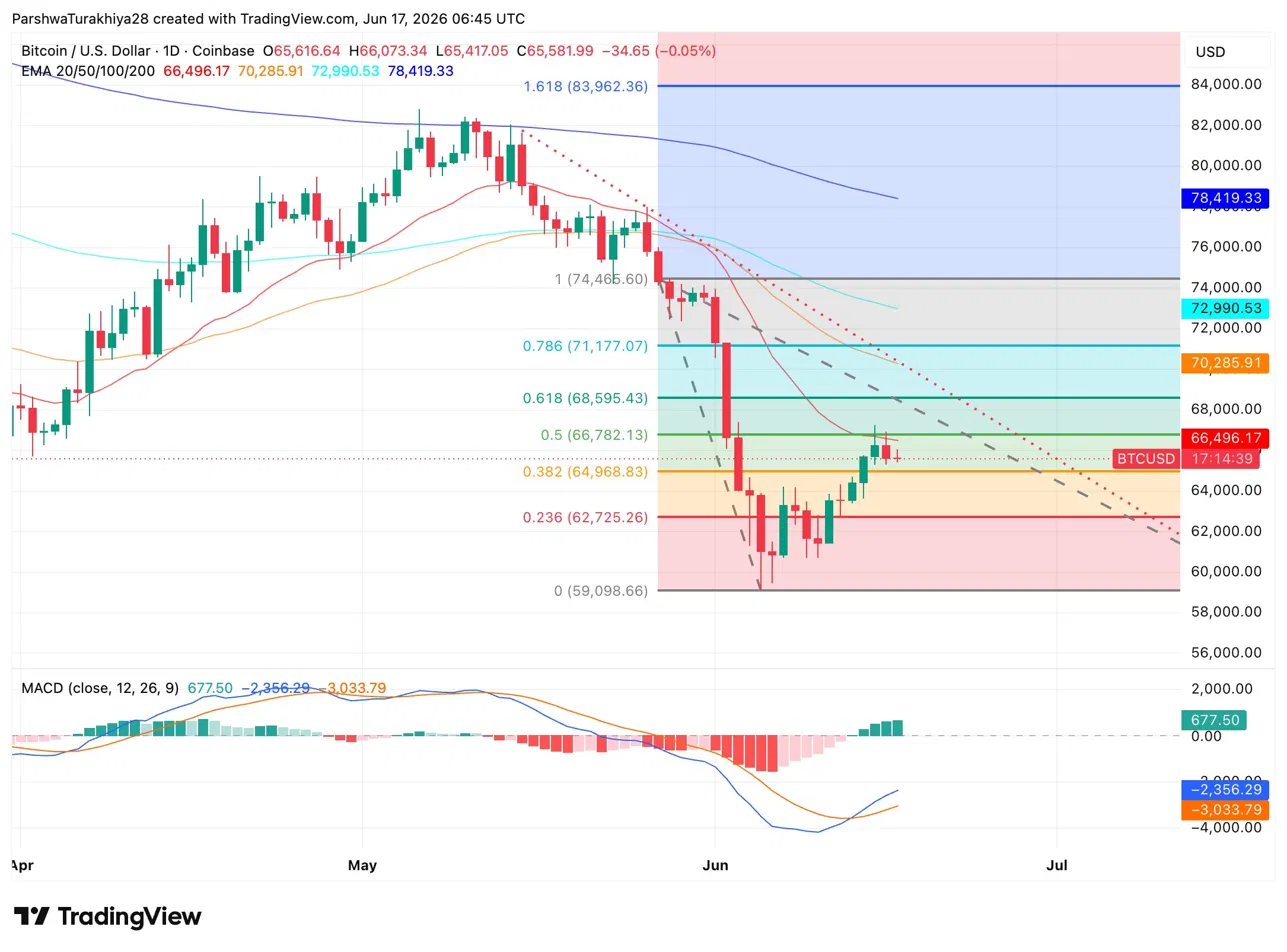
The daily chart shows BTC recovering from the June low at $59,098 into a dense Fibonacci cluster. Price currently sits between the 0.382 level at $64,968 and the 0.5 at $66,782 with the 20 EMA at $66,496 acting as immediate overhead resistance.
Related:
MACD is the most important signal on the chart right now. The lines have crossed bullish from deeply negative territory and the histogram has printed green bars for three consecutive sessions. The last time this cross happened from this depth was after the February 2026 low, which preceded a recovery toward $82,000. The 0.618 Fibonacci at $68,595 is the next target if price can reclaim the 20 EMA.
- Resistance: $66,496 (20 EMA), $68,595 (0.618 Fib), $70,285 (50 EMA)
- Support: $64,968 (0.382 Fib), $62,725 (0.236 Fib)
Galaxy Digital analyzed 13 conditions historically present at every Bitcoin bottom and found only four fully met. Their base case puts the bottom between $40,000 and $46,000. NYDIG takes a similar multi-metric approach and concludes the current pullback shows characteristics of a cyclical low but lacks the outright capitulation of prior major bottoms, though it acknowledges institutional demand could mean a shallower cycle.
Standard Chartered disagrees entirely, calling the $59,000 low the bottom and targeting $100,000 by year-end. It cited the Iran deal resolution and SpaceX IPO-related ETF selling as forces that have now run their course.
Three different conclusions. But all three firms agree the bottom comes this year, all three agree BTC is closer to the bottom than the top, and all three agree another bull cycle follows. Bitwise CIO Matt Hougan cut through the debate with a single line: the bottom question is the wrong one. As long as the top is not in, he argues, Bitcoin is a buy.
Analyst Benjamin Cowen pointed out that BTC has made fools of both sides at every major turn this cycle. The rally from $80,000 to $98,000 in late 2025 triggered supercycle calls before BTC set new cycle lows in February 2026.
Related:
The recovery from $60,000 to $82,000 between February and May 2026 made bears look wrong again before June brought new lows. Cowen’s read is that the cycle is following the typical midterm year pattern and emotions are the only thing that changes outcomes for individual investors.
June 16 recorded $10.06M in net inflows, the third positive session this month after June 4 brought $3.05M and June 12 added $85.85M.
BlackRock’s IBIT led with $16.35M while Fidelity added $4.28M and Morgan Stanley contributed $1.88M. Grayscale’s GBTC was the only significant outflow at $16.81M. Cumulative net inflows stand at $53.57B with total net assets recovering to $82.06B.
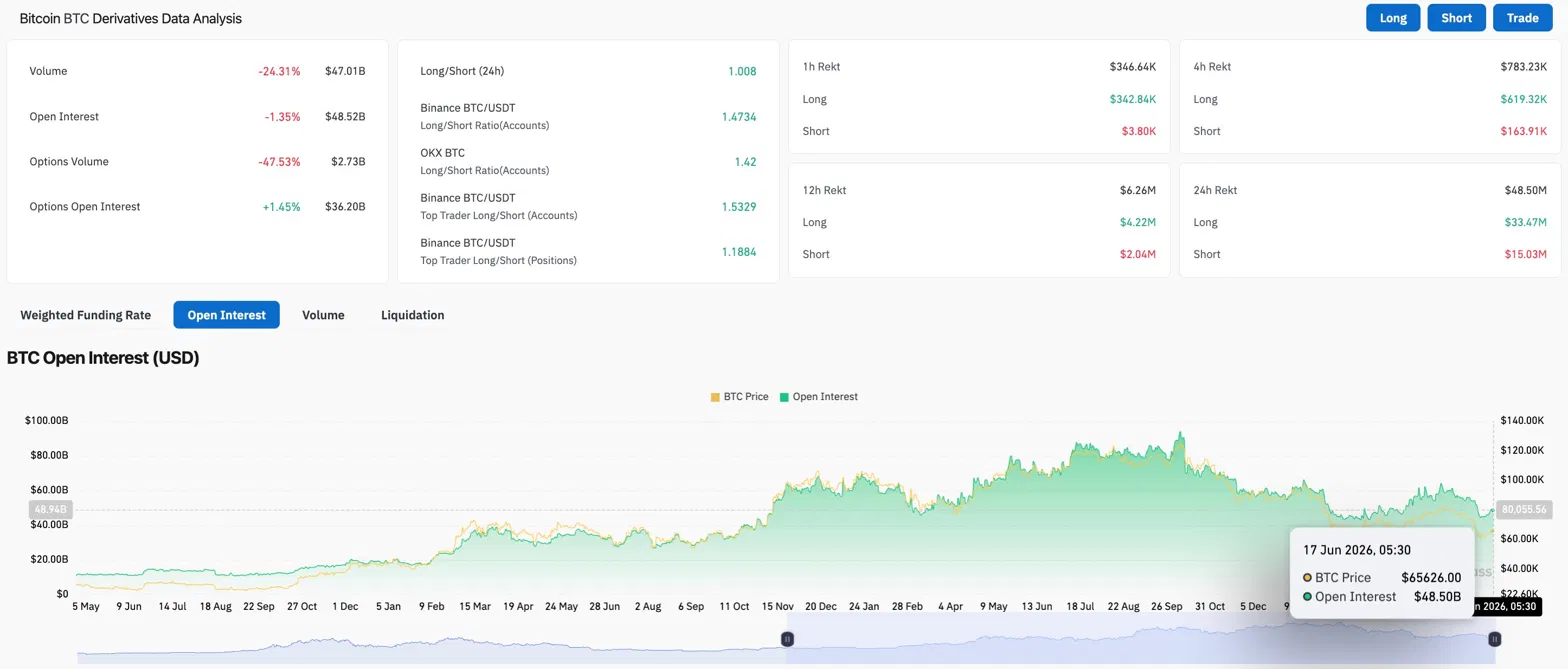
Volume fell 24.31% to $47.01B while open interest dropped 1.35% to $48.52B. Both declining points to position closures ahead of the FOMC decision rather than fresh directional bets. Options volume fell 47.53% to $2.73B while options OI edged up 1.45% to $36.20B. The long/short ratio of 1.008 is effectively neutral.
Over 24 hours, $33.47M in long positions were liquidated against $15.03M in shorts. Longs absorbed more pain but the gap has narrowed significantly from the short squeeze dynamics of last week.
- Upside: A daily close above the 20 EMA at $66,496 and the 0.5 Fibonacci at $66,782 targets $68,595. Continued ETF inflows and a neutral or dovish FOMC outcome accelerate the move toward $70,285.
- Downside: A rejection at $66,496 and close below $64,968 reopens the path toward $62,725. A hawkish surprise from FOMC today would validate Galaxy’s $40,000-$46,000 base case timeline.
Related: