

Although the price of silver has recently retested its lows, the market has not yet seen a decisive breakout to confirm a lasting upward trend. After several periods of heightened volatility, price action has narrowed. Buyers have maintained support along the lower trendline, while short-term selling pressure continues to dominate the upper band.
Silver price holds near $70 as triangle pattern forms
By:Cointurk
Bitget offers one-stop trading for cryptocurrencies, stocks, and gold. Trade now!
A welcome pack worth 6200 USDT for new users! Sign up now!
Compression near the $70 level
Intraday charts indicate that silver is currently trading within a symmetrical triangle formation. This consolidation, developing beneath a descending resistance line, features higher lows around $69.50 and $70.50. The ongoing fluctuations within the range signal a lack of clear directional commitment in the market for now.
If the price pushes above the upper trendline, the recent $71 level may be revisited, with the next key resistance highlighted at $73.09 on the four-hour chart.
The analysis notes that a breakout to the upside could reinforce a short-term recovery. However, if the lower trendline is breached, the outlook could weaken, raising the possibility that silver revisits the upper end of the $60 range or tests even lower price levels.
Resistance builds between $73 and $79
Charts shared by the Economic Office show $73.09 as the first major support and reaction area. According to this analysis, a rebound from around $69.82 toward this zone is one of the main scenarios to monitor ahead of the next major move.
Level Role
| $69.82 | Nearby support zone |
| $73.09 | First key resistance |
| $78.82 | Former support and resistance area |
| $83.05 | Strong resistance level |
| $62 | Bearish scenario target area |
After $73.09, another challenge arises around $78.82. Given this band’s history as both support and resistance, analysts expect renewed selling pressure if silver rallies into this region. The chart also highlights $83.05 as a major resistance, though prices must first clear the $73 to $79 range before that level comes into play.
Four-hour timeframe highs remain below the May peak, indicating that a broader correction is still underway. If a weak bounce leads to fading momentum, the $62 level could become a focal point once again.
Daily indicators point to weakness
On the daily chart, silver is trading below two significant moving averages and currently hovers near $74.20. This area overlaps with a prominent volume node, presenting strong technical resistance for any attempted move higher.
Recent candlestick patterns have not provided a clear signal for future direction. After a bullish candle formed at support, the emergence of a shooting star, doji, and small bearish candles suggest that buying momentum weakened after the initial bounce. In technical analysis, a doji reflects market indecision as buyers and sellers reach a standoff, while a shooting star signals that upward attempts are quickly met with selling.
Glossary: A doji is a candlestick formation where the opening and closing prices are very close, indicating hesitation in the market. A shooting star shows that, despite an intraday rise, closing prices drop back and selling pressure at resistance intensifies.
The RSI stands at 41, which means momentum is below the neutral 50 threshold. Meanwhile, the MACD signal remains under the zero line, reflecting the ongoing dominance of sellers over a broader timeframe.
At present, silver continues to trade between support at $69 and resistance at $73.09. Whether the intraday triangle breaks to the upside or downside will determine if prices head toward the $74 region with heavier volume or retreat to the June support zone near $62.
0
0
Disclaimer: The content of this article solely reflects the author's opinion and does not represent the platform in any capacity. This article is not intended to serve as a reference for making investment decisions.
Understand the market, then trade.
Bitget offers one-stop trading for cryptocurrencies, stocks, and gold.
Trade now!
You may also like
A New XRP Catalyst? Ripple’s Schwartz Teases ‘New Ways People Are Using XRP’ Before Swell 2026
Tipranks•2026/06/18 14:27
The Market Just Played Its Cruelest Trick — These 5 Altcoins Could Reward Those Who Refused to Panic Sell
Cryptonewsland•2026/06/18 14:27
MSCI to decide on Argentina’s potential return to global indexes next week
Cryptobriefing•2026/06/18 14:24
Digital asset treasury companies face challenges as public model weakens
Cryptobriefing•2026/06/18 14:18
Trending news
MoreCrypto prices
MoreBitcoin
BTC
$63,779.98
-2.10%
Ethereum
ETH
$1,731.09
-1.36%
Tether USDt
USDT
$0.9987
-0.05%
USDC
USDC
$0.9997
+0.00%
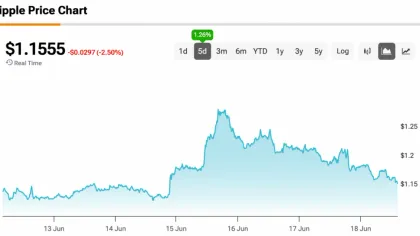
XRP
XRP
$1.16
-3.23%
Solana
SOL
$71.26
-1.52%
TRON
TRX
$0.3196
-0.32%
Hyperliquid
HYPE
$69.59
-3.58%
Dogecoin
DOGE
$0.08396
-2.75%
Stellar
XLM
$0.2488
+9.97%
How to buy BTC
Bitget lists BTC – Buy or sell BTC quickly on Bitget!
Trade now
Become a trader now?A welcome pack worth 6200 USDT for new users!
Sign up now