Bitget App
Trade smarter
Buy cryptoMarketsTradeFuturesStocksEarnInstitutionAI & More
Has EDGE found a local bottom after its sharp correction? Assessing…

Has EDGE found a local bottom after its sharp correction? Assessing…

CryptoNewsNetCryptoNewsNet2026/06/21 05:27
By:CryptoNewsNet
Back to the list

Has EDGE found a local bottom after its sharp correction? Assessing…

Has EDGE found a local bottom after its sharp correction? Assessing… image 0  ambcrypto.com 2 h
Has EDGE found a local bottom after its sharp correction? Assessing… image 1

After losing nearly three-quarters of its value in a matter of weeks, EdgeX [$EDGE] finally showed signs of life as traders returned to the market.

The token climbed 19% to $0.400 over the past 24 hours while trading volume jumped 39% to $12.53 million, suggesting that participants had begun re-engaging with the asset.

Unlike earlier sessions that attracted limited participation, the latest advance developed alongside stronger trading activity.

As a result, buyers appeared more willing to step in despite the broader bearish backdrop.

While the recovery remained modest compared to the scale of the previous decline, the increase in volume suggested that traders had started paying attention to $EDGE again.

Fresh capital enters the derivatives market

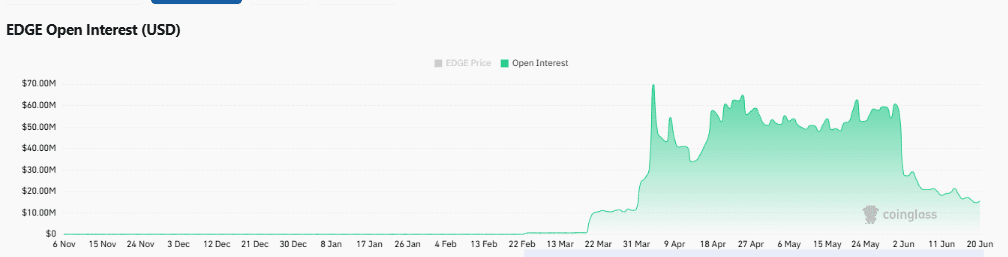
Interest in leveraged positions also increased as traders expanded their exposure to $EDGE. Open Interest climbed 21.39% to $17.52 million, indicating that new positions entered the Futures market during the rally.

This increase carried greater significance because it followed a period of sustained selling pressure that had driven the token sharply lower.

Rising Open Interest alongside a higher price often reflects growing conviction among market participants rather than a temporary reaction from existing holders. The increase suggested that traders expected volatility to remain elevated in the near term.

Although higher leverage can amplify risk, it also highlighted stronger engagement across derivatives markets. For now, participants appeared increasingly willing to position for further price movement as $EDGE attempted to build a base above its recent lows.
Has EDGE found a local bottom after its sharp correction? Assessing… image 2 Source: CoinGlass

Short sellers feel the pressure

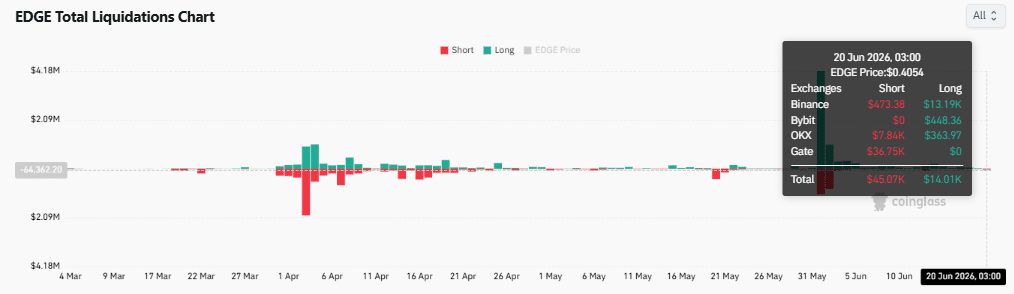
Liquidation data revealed that bearish traders absorbed most of the market pressure during the latest recovery attempt.

Total short liquidations reached approximately $45,070, while long liquidations totaled around $14,010.

The imbalance indicated that the upward move forced a larger number of short sellers to close positions, adding further buying activity to the market. Binance recorded the largest share of short liquidations, with roughly $473,480 wiped out during the session.

This development suggested that some traders had continued betting on downside even as the token stabilized. As prices moved higher, those positions became increasingly vulnerable.

Although liquidation volumes remained relatively modest, the disparity between shorts and longs reflected improving sentiment across the market.
Has EDGE found a local bottom after its sharp correction? Assessing… image 3 Source: CoinGlass

Is $EDGE ready to reclaim lost ground?

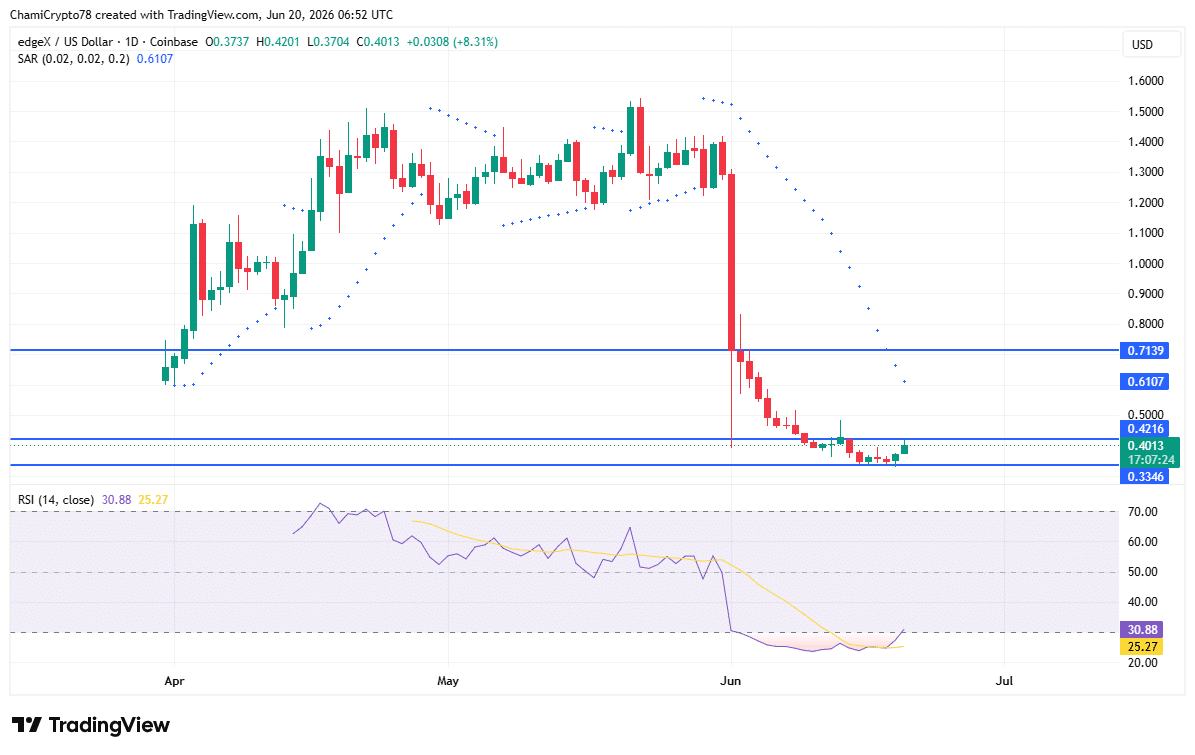
$EDGE continued attempting to recover after its dramatic collapse from the $1.50 region earlier this month.

At the time of analysis, $EDGE traded around $0.4013 and approached the $0.4216 resistance level, which marked an important barrier following the recent breakdown.

RSI climbed to 30.88 after spending several sessions in deeply oversold territory, indicating that selling pressure had eased considerably.

Even so, the indicator remained below the neutral 50 mark, showing that buyers had not fully regained control. Meanwhile, the Parabolic SAR stayed above price, maintaining a bearish signal despite the recent rebound.

This divergence suggested that recovery efforts had strengthened, though the broader trend had not yet shifted.
Has EDGE found a local bottom after its sharp correction? Assessing… image 4 Source: TradingView

If buyers secure a move above $0.4216, the next upside target could emerge near $0.5000. However, failure to clear resistance could expose the token to another test of support around $0.3346.

Final Summary

  • Volume and Open Interest increased together, showing traders returned after weeks of weakness.
  • Resistance near $0.42 remains crucial as the broader trend stays under pressure.

0
0

Disclaimer: The content of this article solely reflects the author's opinion and does not represent the platform in any capacity. This article is not intended to serve as a reference for making investment decisions.

Understand the market, then trade.
Bitget offers one-stop trading for cryptocurrencies, stocks, and gold.
Trade now!

You may also like

The script at the end of 2018: The Federal Reserve continued to raise interest rates, US stocks plunged 20% from the September highs, forcing the Federal Reserve to "pivot" in January.

Goldman Sachs' head of trading believes the current US stock market is repeating the scenario of late 2018, with monetary tightening and equity market pressure. The Goldman Sachs Financial Conditions Index has tightened by about 8 points in two weeks, reaching the highest level in a year. The selloff has broadened from tech stocks to defensive sectors. Gold and equities are declining simultaneously, possibly indicating investors are selling assets to raise cash, making gold a key indicator for observing liquidity stress.

华尔街见闻•2026/11/21 05:31
The script at the end of 2018: The Federal Reserve continued to raise interest rates, US stocks plunged 20% from the September highs, forcing the Federal Reserve to "pivot" in January.

Goldman Sachs Trader “Revisits the 2018 Playbook”: Still Clearly Remembers “On December 24th, Clients Asked Why the Market Dropped So Much—And I Had No Idea”

Brian Garrett pointed out that the current adjustment in the US stock market is similar to the sharp decline in Q4 2018: the S&P 500 has already experienced 42% of the corresponding drop, and the VIX is approaching its peak just before Christmas. If history repeats itself, the bottom of this cycle may appear in January next year. However, the credit market and Federal Reserve policy have yet to provide clear signals of a bottom.

华尔街见闻•2026/11/21 03:51

Anthropic (ANT.US) nearly “broke issue price,” but Claude knocks on the doors of “the highest peak in mathematics”! 17 million lines of Lean code used to write a candidate proof for the Riemann Hypothesis

On November 20th, Eastern Time, on its second day of trading, Anthropic's intraday price dropped to a low of $83.05, just 5 cents above the offering price of $83, and finally closed at $88.91, a decline of 8.50%. On the same day, the company's mathematician Levant Alperg announced on his personal website that he and Claude had found a candidate proof for the Riemann hypothesis, which has puzzled the mathematics community for 167 years, and released about 17 million lines of Lean formalized code.

智通财经•2026/11/21 03:21
Anthropic (ANT.US) nearly “broke issue price,” but Claude knocks on the doors of “the highest peak in mathematics”! 17 million lines of Lean code used to write a candidate proof for the Riemann Hypothesis

As US stocks plummet, the parent company of GTA 6 rises against the market! First-day sales hit a record $3.79 billion; Wall Street shifts focus to next-generation GTA Online.

According to Rentrak data, the global box office of "Grand Theft Auto VI" has also surpassed that of "Avengers: Endgame," the highest-grossing film of all time, which has a global box office of approximately $2.94 billion.

智通财经•2026/11/21 02:41
As US stocks plummet, the parent company of GTA 6 rises against the market! First-day sales hit a record $3.79 billion; Wall Street shifts focus to next-generation GTA Online.