

 en.cryptonomist.ch
Micron stock surged after a blowout fiscal Q3 earnings report, with sales up 346% year-on-year and guidance 14.5% above consensus. MU opened near $1,082 before pulling back to $1,048.51 intraday. The daily trend remains firmly bullish, yet the hourly structure urges caution.
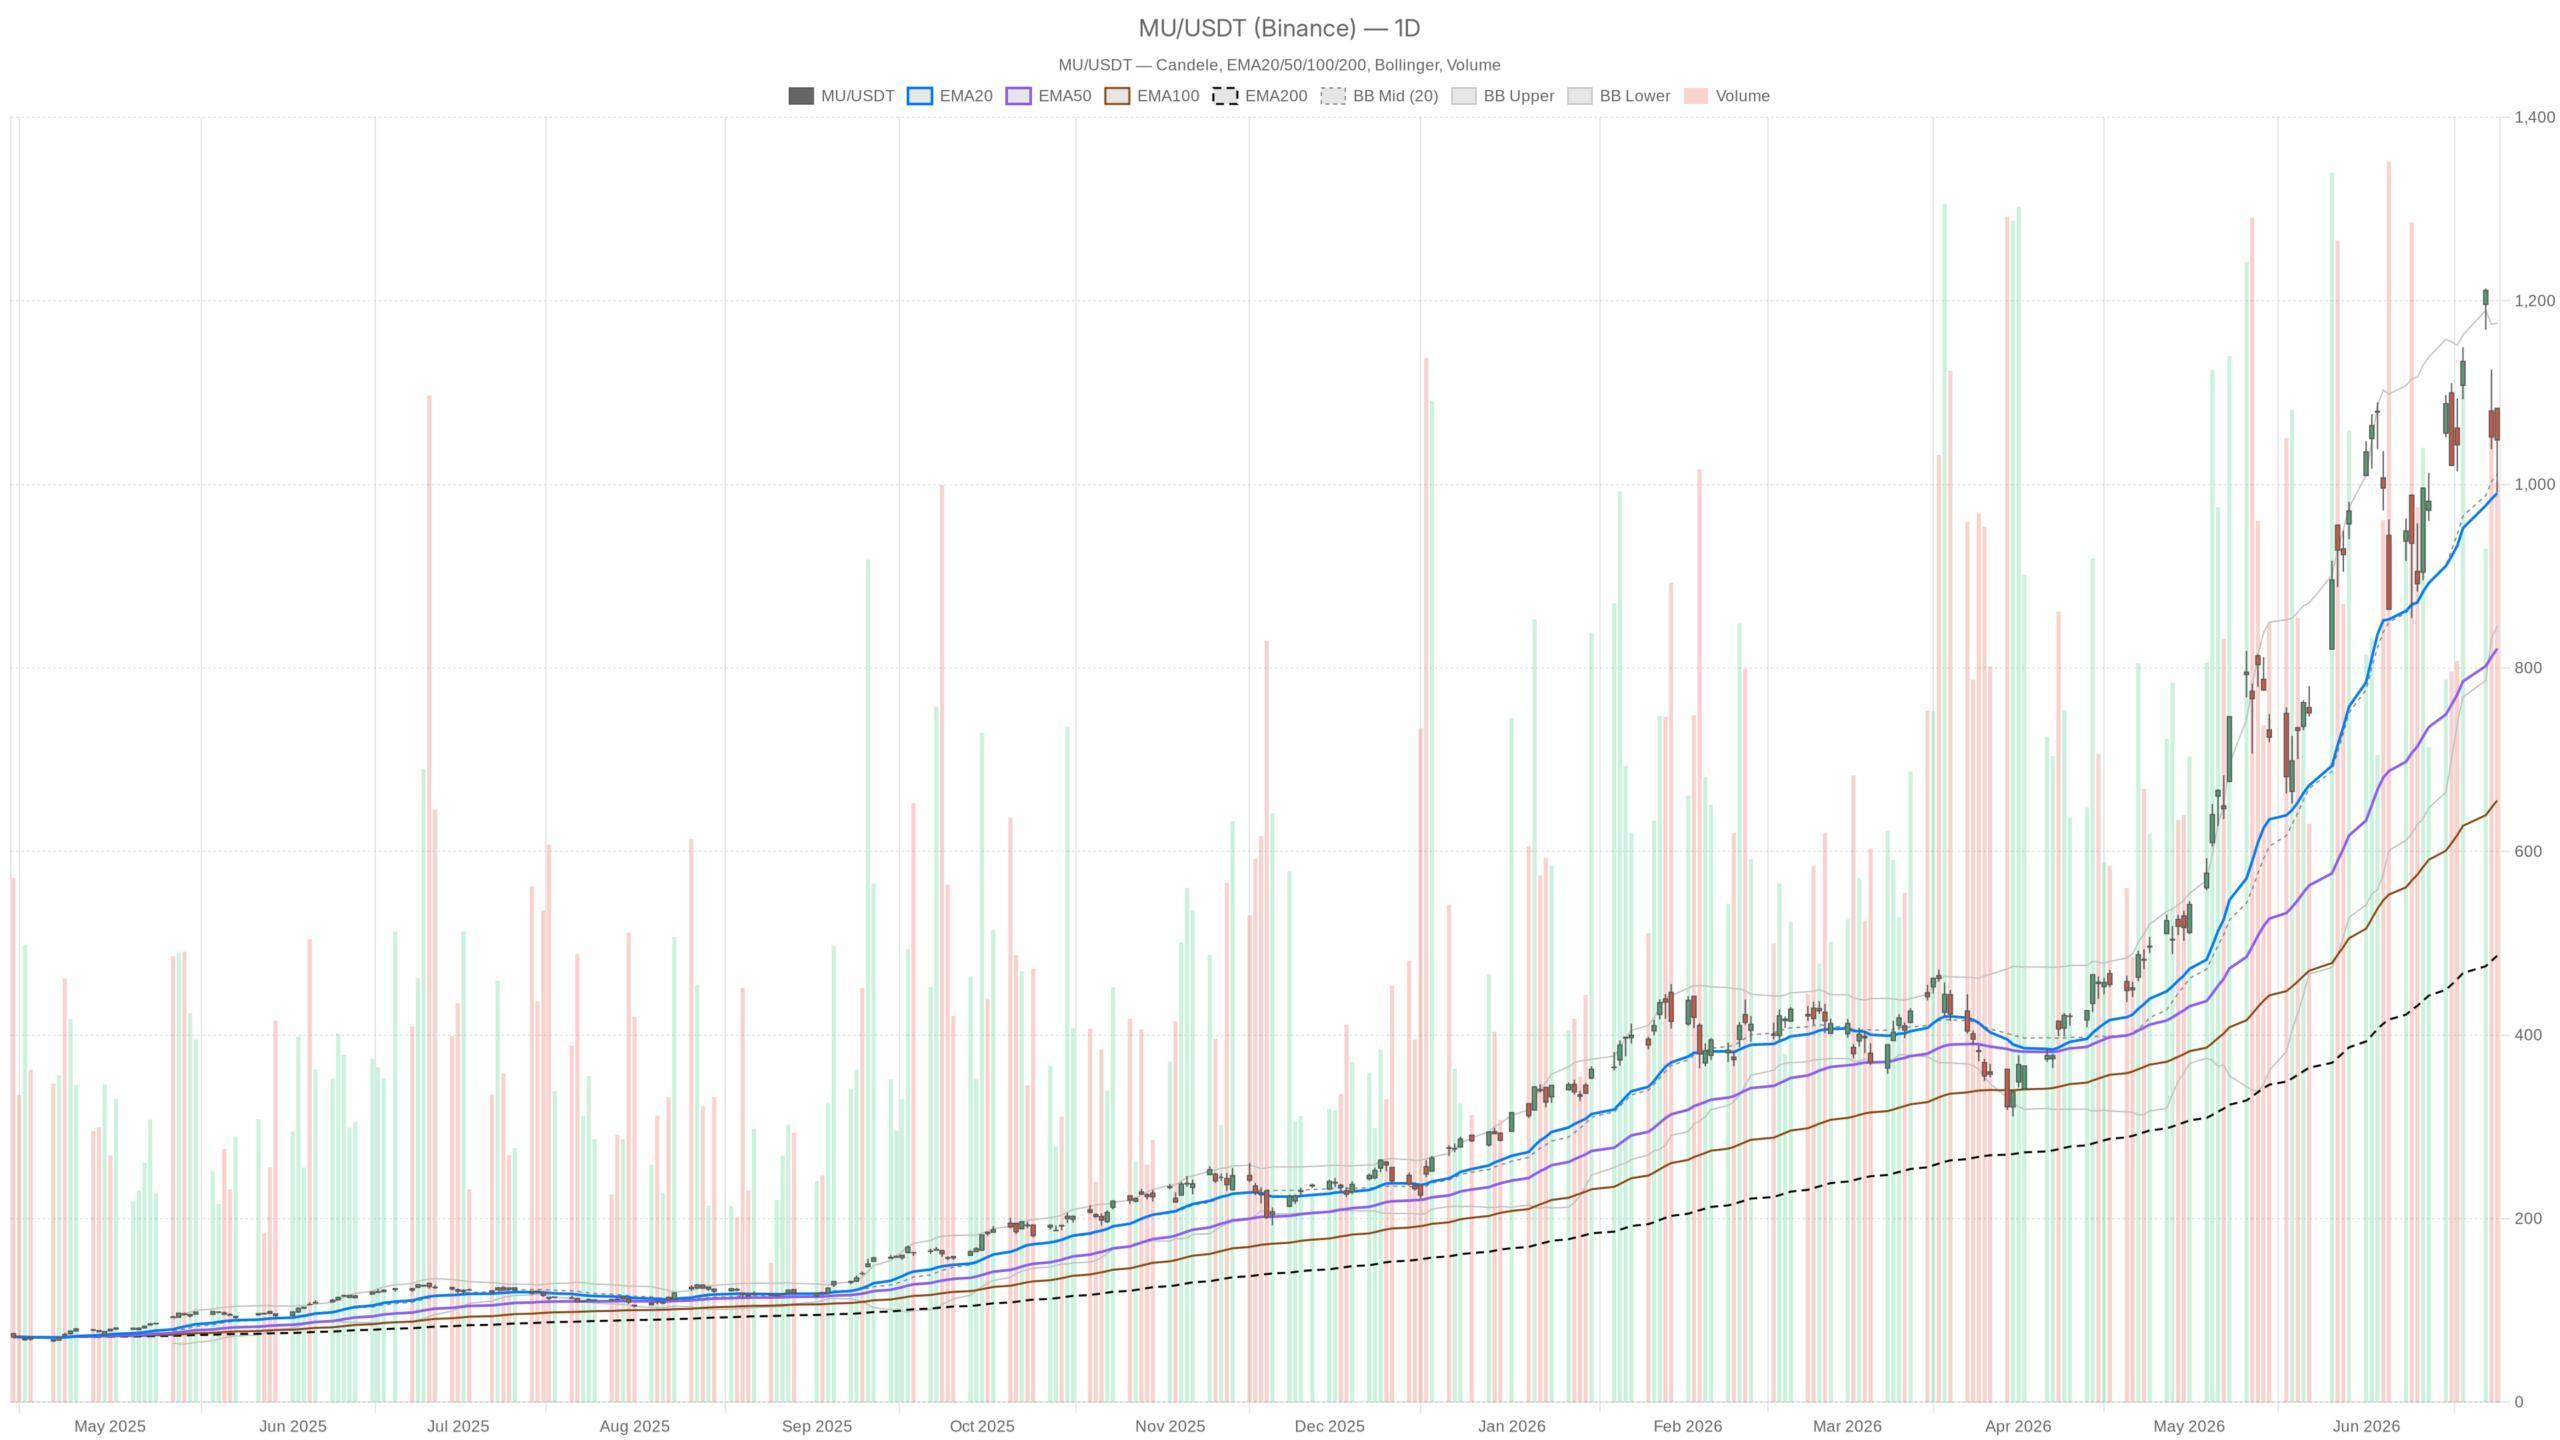 MU — daily chart with candlesticks, EMA20/EMA50 and volume.
Key takeaways
- MU delivered a massive fiscal Q3 beat with sales surging 346% YoY to $41.46 billion and guidance of $50 billion, roughly 14.5% above consensus.
- The daily EMA stack remains deeply bullish, with price well above the 20-day, 50-day, and 200-day EMAs.
- Hourly indicators are mixed: price trades below both the 20-hour and 50-hour EMAs, with a deeply negative MACD histogram.
- Daily support sits at $998.63 (S1), while resistance stands at $1,090.85 (R1); the pivot at $1,040.98 acts as a neutral anchor.
- With a daily ATR above $102, Micron stock demands disciplined position sizing and tolerance for wide intraday swings.
Daily Trend Architecture Confirms Bullish Regime
Micron stock’s daily timeframe confirms a deeply entrenched uptrend, with a stacked EMA alignment that leaves little room to question the primary direction. MU trades well above its 20-day EMA at $990.24. It also sits far above the 50-day EMA at $821.12 and the 200-day EMA at $486.38. This stacked alignment across all three averages signals persistent bullish momentum.
Price sits comfortably above the Bollinger Band midline at $1,010.71. However, it remains well within the upper band at $1,175.74. That suggests room to extend without immediate overextension risk — a constructive setup after an earnings gap. Meanwhile, the daily pivot structure places key support at $998.63 (S1) and resistance at $1,090.85 (R1), with the pivot point at $1,040.98. MU closed right around this pivot level, which historically acts as a neutral anchor. A sustained close above R1 would open the path toward the upper Bollinger Band.
Momentum Signals Flash Mixed Near-Term Warnings
The trend structure is bullish, but momentum indicators present a more nuanced picture that argues against aggressive immediate chasing. The daily RSI at 56.81 supports the bullish bias without flashing any overbought warning. There is momentum here, yet not the kind of frothy exhaustion that tends to precede sharp reversals.
Meanwhile, the daily MACD introduces a mild complication. The MACD line sits at 89.35 against a signal of 93.29, producing a slightly negative histogram of -3.94. That minor bearish cross reflects a short-term deceleration in momentum, not a trend reversal. Still, it argues against aggressive buying above current levels. The daily ATR of $102.99 further underscores how wide the trading range has become. A single session can move over $100. This demands respect when sizing positions, particularly around post-earnings price discovery.
Intraday Structure Introduces Caution on Micron Stock
The hourly chart complicates the bullish thesis, with MU trading in a corrective phase that has not yet resolved. Price at $1,048.50 is trading below both the 20-hour EMA at $1,069.30 and the 50-hour EMA at $1,066.48. This means on the intraday structure, MU is in a corrective phase relative to its recent swing highs. The hourly pivot support at $1,024.41 represents the first meaningful floor to watch.
At the same time, the 1H Bollinger Band lower boundary at $959.15 and the 200-hour EMA at $937.39 remain well below current price. These levels confirm that any short-term weakness is a pullback within a bull trend, not a structural breakdown.
Short-Term Momentum Indicators Lean Bearish
The hourly MACD reinforces the cautious read. The line is at -20.30, the signal at -10.96, and the histogram sits at a deeply negative -9.35. Short-term selling pressure on the hourly is not trivial. In addition, the 1H RSI at 44.39 sits below the 50 midline. This suggests that on an hourly basis, bears hold a slight edge.
15-Minute Chart Offers Execution-Level Clarity
Turning to the 15-minute chart for execution context, the picture is more constructive than the hourly. MU closed the last 15-minute candle at $1,048.50 with a strong move from the $1,020 open, pushing to a high of $1,049. The 15m MACD histogram has turned positive at 2.93, suggesting very near-term momentum is shifting back in favor of buyers.
Similarly, the 15m RSI at 55.46 sits just above the midline, consistent with a mild short-term bullish lean. Price is pressing against the upper 15m Bollinger Band at $1,056.27. This level could act as a near-term ceiling without a sustained catalyst to breach it.
Bullish Scenario: Reclaim and Run
The bullish path requires MU to absorb intraday selling pressure and reclaim the hourly EMA cluster. A post-earnings session where Micron stock holds above the $1,040 daily pivot and reclaims the $1,066–$1,069 hourly EMA cluster would signal that selling pressure has been absorbed. From there, a push toward $1,090 (daily R1) and eventually the upper Bollinger Band near $1,175 becomes credible.
Overall, the fundamental backdrop supports this scenario. Explosive revenue growth, AI-driven memory demand, and guidance well ahead of expectations provide a narrative that institutional buyers can anchor to. AI customers, as one analyst framed it, are treating memory as a bottleneck they cannot afford to leave to chance.
Bearish Scenario: Fade the Gap
If Micron stock fails to reclaim the hourly EMA cluster, the bearish scenario gains traction quickly. Sellers pressing the stock below $1,024 (hourly S1) would make the daily $998.63 support the next logical test. A daily close below the 20-day EMA at $990.24 would be a meaningful warning sign. It would raise the possibility that the post-earnings pop is being faded by profit-taking.
Notably, MU had already shed as much as 12% in the session preceding earnings. This means some of the good news may have been partially anticipated and traded ahead. That scenario would not invalidate the multi-month bull trend. However, it would suggest a deeper consolidation phase before any resumption higher.
Overall Assessment
Micron stock remains structurally bullish on the primary timeframe, but patience is warranted until the hourly structure catches up. The AI memory trade has been reset by blowout earnings, and the price structure supports that repricing. At the same time, the hourly setup is genuinely mixed, with momentum indicators pointing to unresolved selling pressure after the initial gap.
Traders operating on short timeframes will need to watch the $1,024–$1,040 support zone closely. With an ATR north of $100, this is not a stock for those uncomfortable with wide intraday swings. The thesis is intact — but patience, rather than aggression, may be the more appropriate posture until the hourly structure catches up with the daily trend.
FAQ
What is Micron stock’s primary trend direction?
Micron stock is in a deeply entrenched bullish trend on the daily timeframe. Price trades well above the 20-day, 50-day, and 200-day EMAs, with all three averages stacked in bullish alignment.
What key levels should traders watch on MU?
Key support sits at $1,024.41 (hourly S1) and $998.63 (daily S1). Resistance stands at $1,090.85 (daily R1), with the upper Bollinger Band near $1,175.74 acting as a longer-term target.
Why is caution warranted despite the blowout earnings?
The hourly chart shows MU trading below both the 20-hour and 50-hour EMAs, with a deeply negative MACD histogram at -9.35. This intraday selling pressure has not yet resolved, suggesting patience is warranted before adding to positions.
How volatile is Micron stock currently?
Extremely. The daily ATR sits at $102.99, meaning a single session can produce moves exceeding $100. This demands disciplined position sizing and comfort with wide intraday swings.
Article produced with the assistance of artificial intelligence and reviewed by the editorial team.

