
A Chart Overview of Commodity Support and Resistance: Gold, Silver, Oil, Gas + Platinum, Palladium, Copper, and Agricultural Futures (June 29, 2026)

Exchange Rate Network June 29 News —— One chart for commodity support and resistance: gold, silver, oil, gas + platinum, palladium, copper + agricultural futures, updated at 06:15 on Monday, June 29, 2026 (UTC+8), specifically covering 14 varieties including gold, silver, platinum, palladium, copper + crude oil, natural gas, fuel oil + wheat, corn, and cotton. For more details, please refer to the custom charts in Huixun Financial Analysis.
One chart for commodity support and resistance: gold, silver, oil, gas + platinum, palladium, copper + agricultural futures, updated at 06:15 on Monday, June 29, 2026 (UTC+8), specifically covering 14 varieties including gold, silver, platinum, palladium, copper + crude oil, natural gas, fuel oil + wheat, corn, and cotton. For more details, please refer to the custom charts in Huixun Financial Analysis.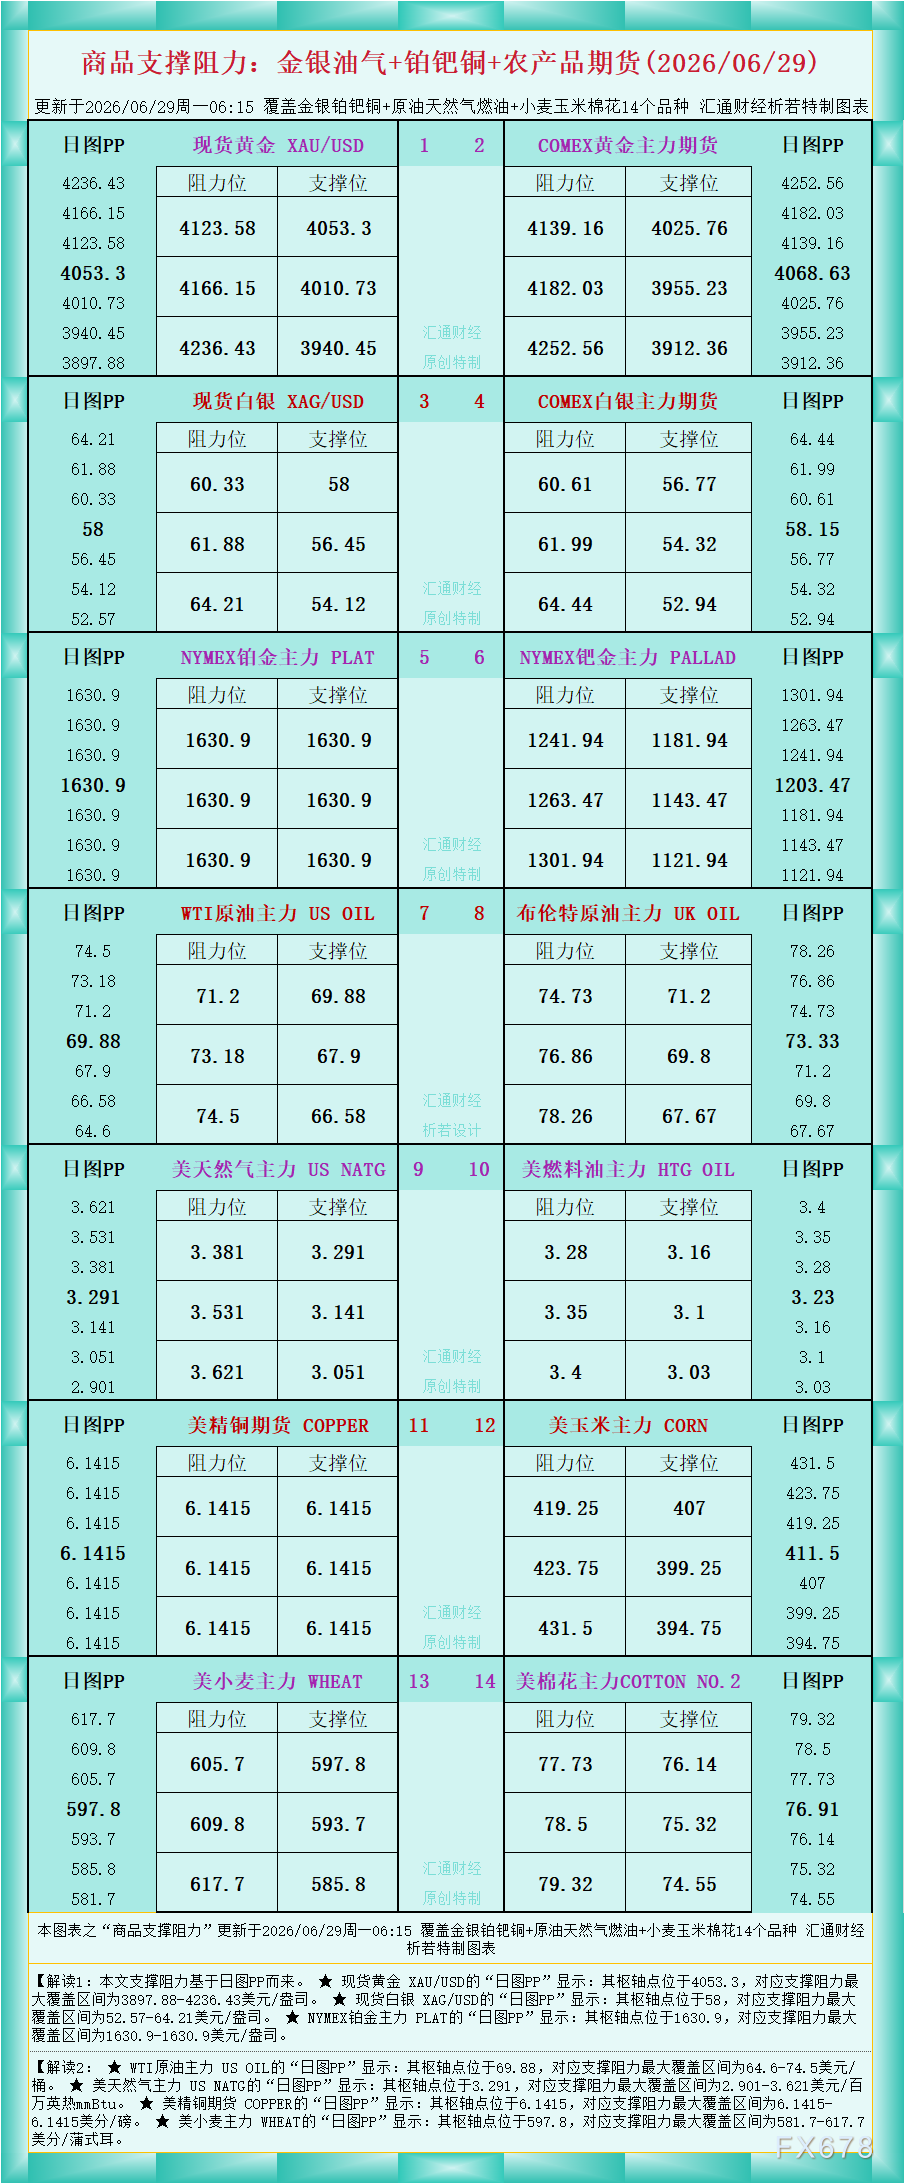
As shown in the chart, Interpretation 1: The support and resistance in this article are based on the daily PP.
★ The "daily PP" for spot gold XAU/USD shows: the pivot is at 4053.3, with the maximum support and resistance range between $3897.88–$4236.43 per ounce.
★ The "daily PP" for spot silver XAG/USD shows: the pivot is at 58, with the maximum support and resistance range between $52.57–$64.21 per ounce.
★ The "daily PP" for NYMEX platinum main contract PLAT shows: the pivot is at 1630.9, with the maximum support and resistance range between $1630.9–$1630.9 per ounce.
Interpretation 2:
★ The "daily PP" for WTI crude oil main contract US OIL shows: the pivot is at 69.88, with the maximum support and resistance range between $64.6–$74.5 per barrel.
★ The "daily PP" for US natural gas main contract US NATG shows: the pivot is at 3.291, with the maximum support and resistance range between $2.901–$3.621 per million British thermal units (mmBtu).
★ The "daily PP" for US copper futures COPPER shows: the pivot is at 6.1415, with the maximum support and resistance range between 6.1415–6.1415 cents/pound.
★ The "daily PP" for US wheat main contract WHEAT shows: the pivot is at 597.8, with the maximum support and resistance range between 581.7–617.7 cents/bushel.
For interpretations of more varieties, see the chart.
Disclaimer: The content of this article solely reflects the author's opinion and does not represent the platform in any capacity. This article is not intended to serve as a reference for making investment decisions.
You may also like

Australian Dollar holds steady below 0.6900 on US–Iran talks uncertainty
This morning, the market panicked for only 20 minutes
