
Bullish Bitcoin RSI divergence has analysts calling for 2022-style bear market bottom

Bitcoin (BTC) continued its battle to reclaim $60,000 into the weekend as chart cues fueled hopes of a recovery.
Key points:
- Bitcoin RSI signals spark comparisons to the end of the 2022 bear market as a bullish divergence filters through.
- Analysis sees "encouraging" evidence of buyers defending the market at $60,000.
- Some traders still see new lows coming, but these could take until August.
Analysis on Bitcoin RSI: "It's 2022 again"
Data from TradingView showed BTC/USD cooling volatility after returning above the $60,000 mark.
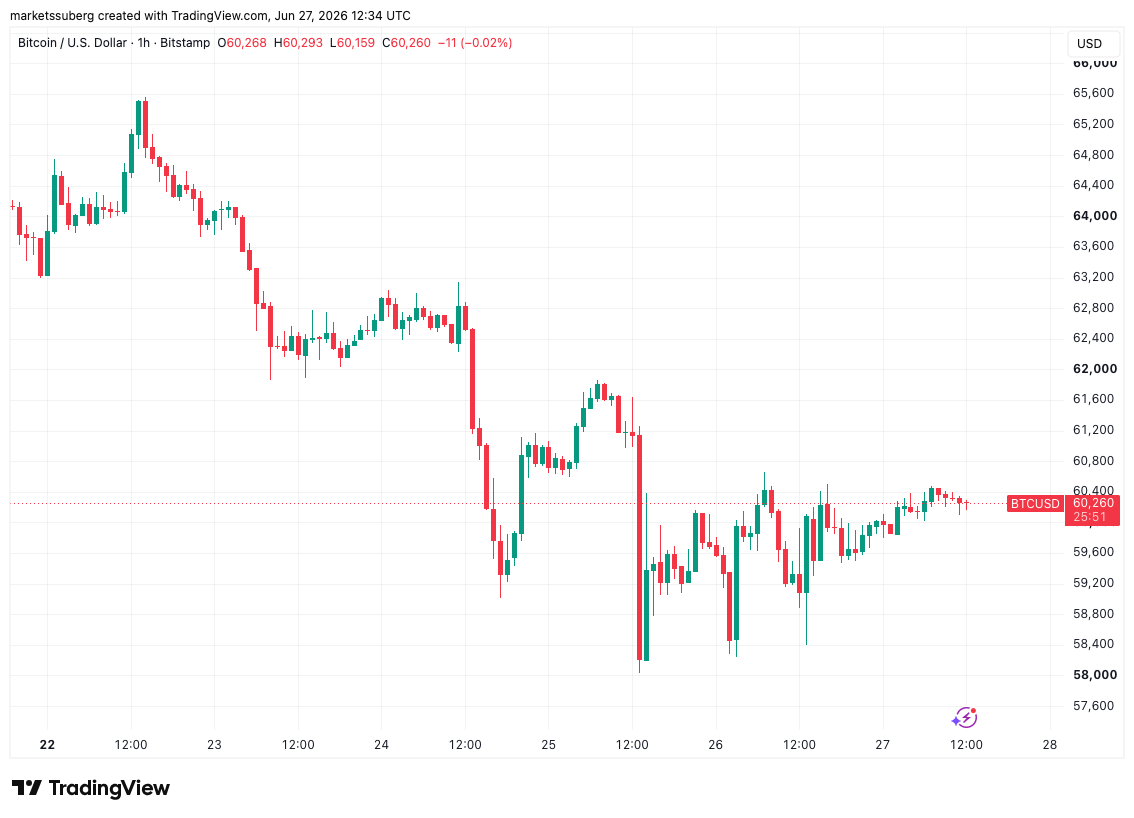
BTC/USD one-hour chart. Source: Cointelegraph/TradingView
A series of higher swing lows on hourly time frames combined with encouraging readings from the relative strength index (RSI) indicator.
On the four-hour chart, a bullish divergence was occurring, where RSI makes higher lows while price makes lower lows. This caught the attention of market participants, who began to anticipate a BTC price reversal as a result.
Uploading a chart comparing the current bear market with 2022, pseudonymous trader Rod argued that history was repeating itself.
“Once you see it, you can't unsee it,” they wrote in a post on X.
“It's 2022 again.”
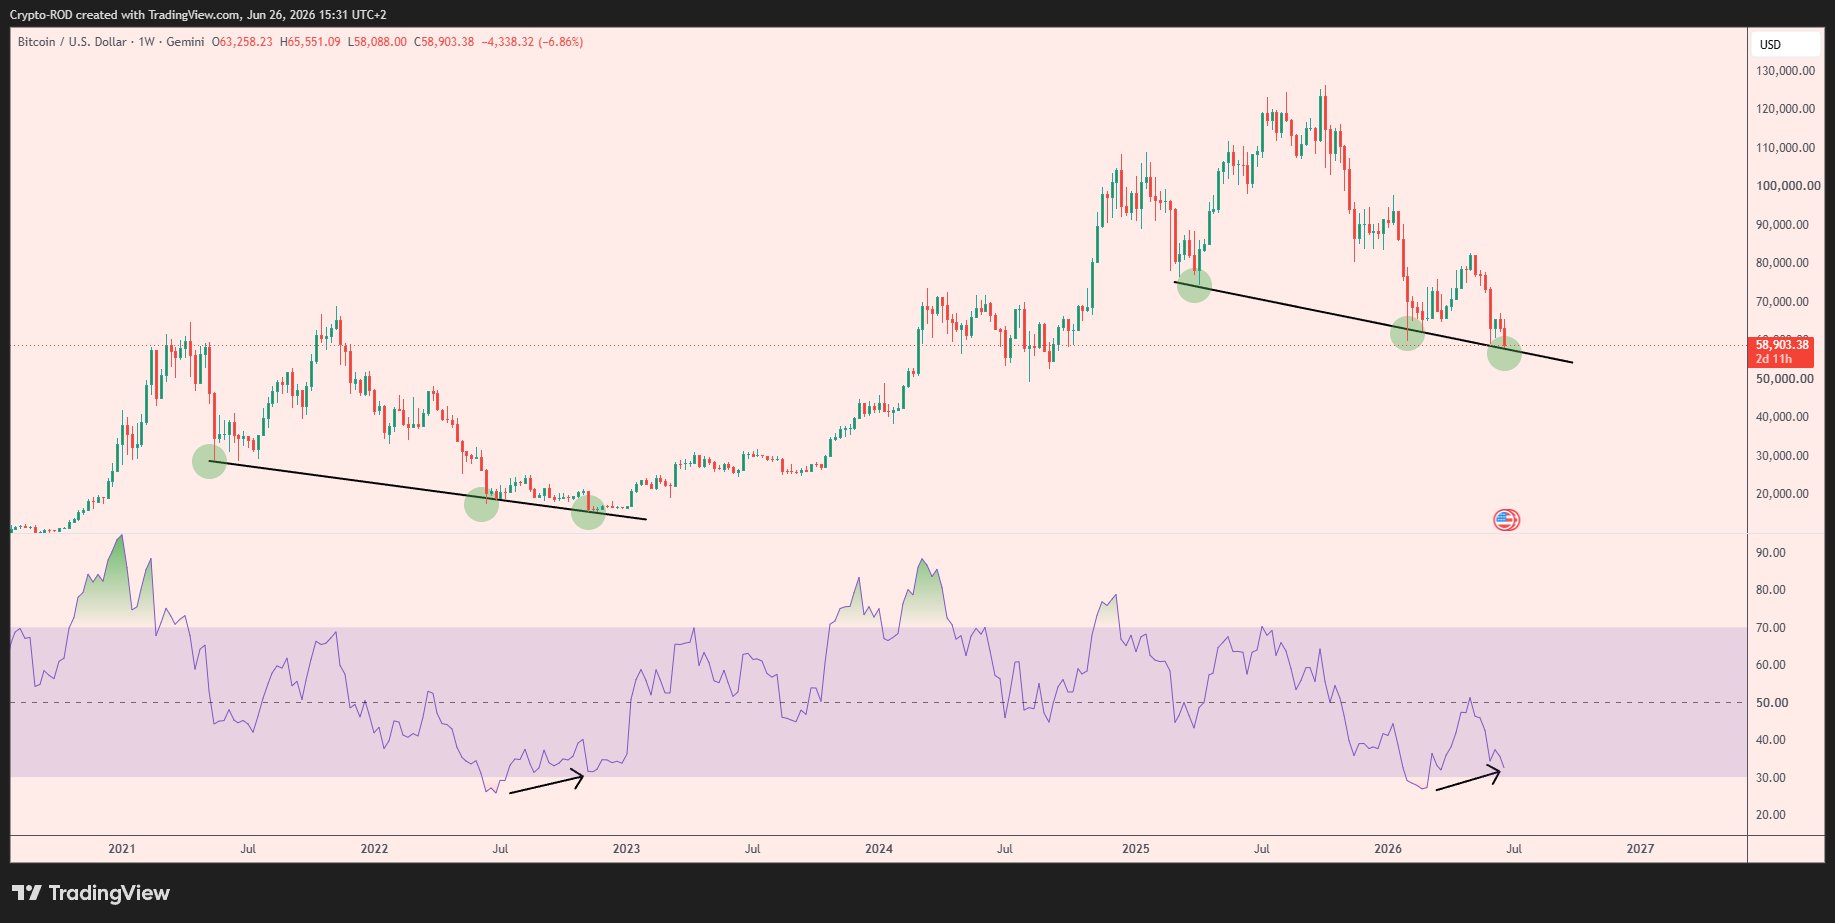
BTC/USD one-week chart with RSI data. Source: Rod/X
At the time, a weekly RSI bullish divergence kicked in while BTC/USD set its bear-market low of $15,600 — an event that subsequently provided a durable market floor.
Four-hour RSI, meanwhile, fell to just 11.4 at the start of June, marking one of its lowest levels on record.
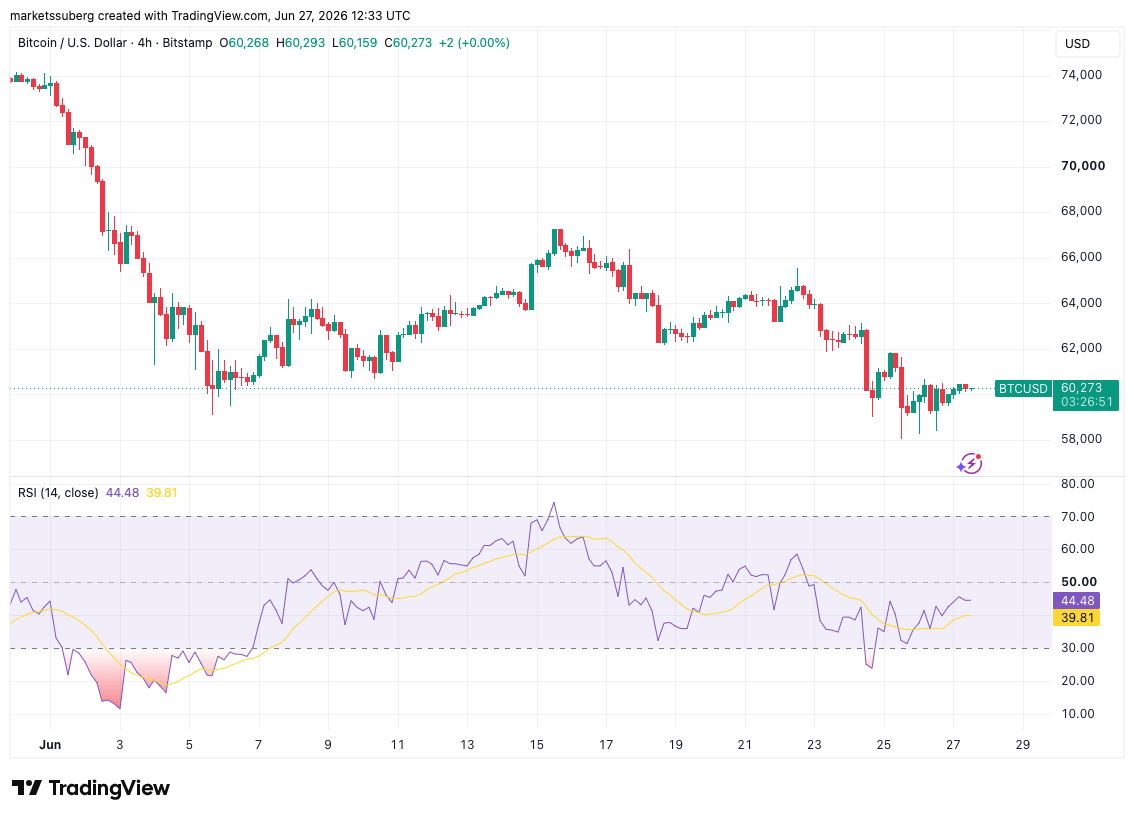
BTC/USD four-hour chart with RSI data. Source: Cointelegraph/TradingView
On Friday, crypto analyst Lukasz Wydra added daily time frames to the mix of RSI bull signals.
“The bullish RSI divergence on the Bitcoin chart has now been officially confirmed. It may still deepen, but at the same time we can clearly see that Binance continues to defend the price,” he told X followers.
Wydra described the RSI signals as an “encouraging sign.”
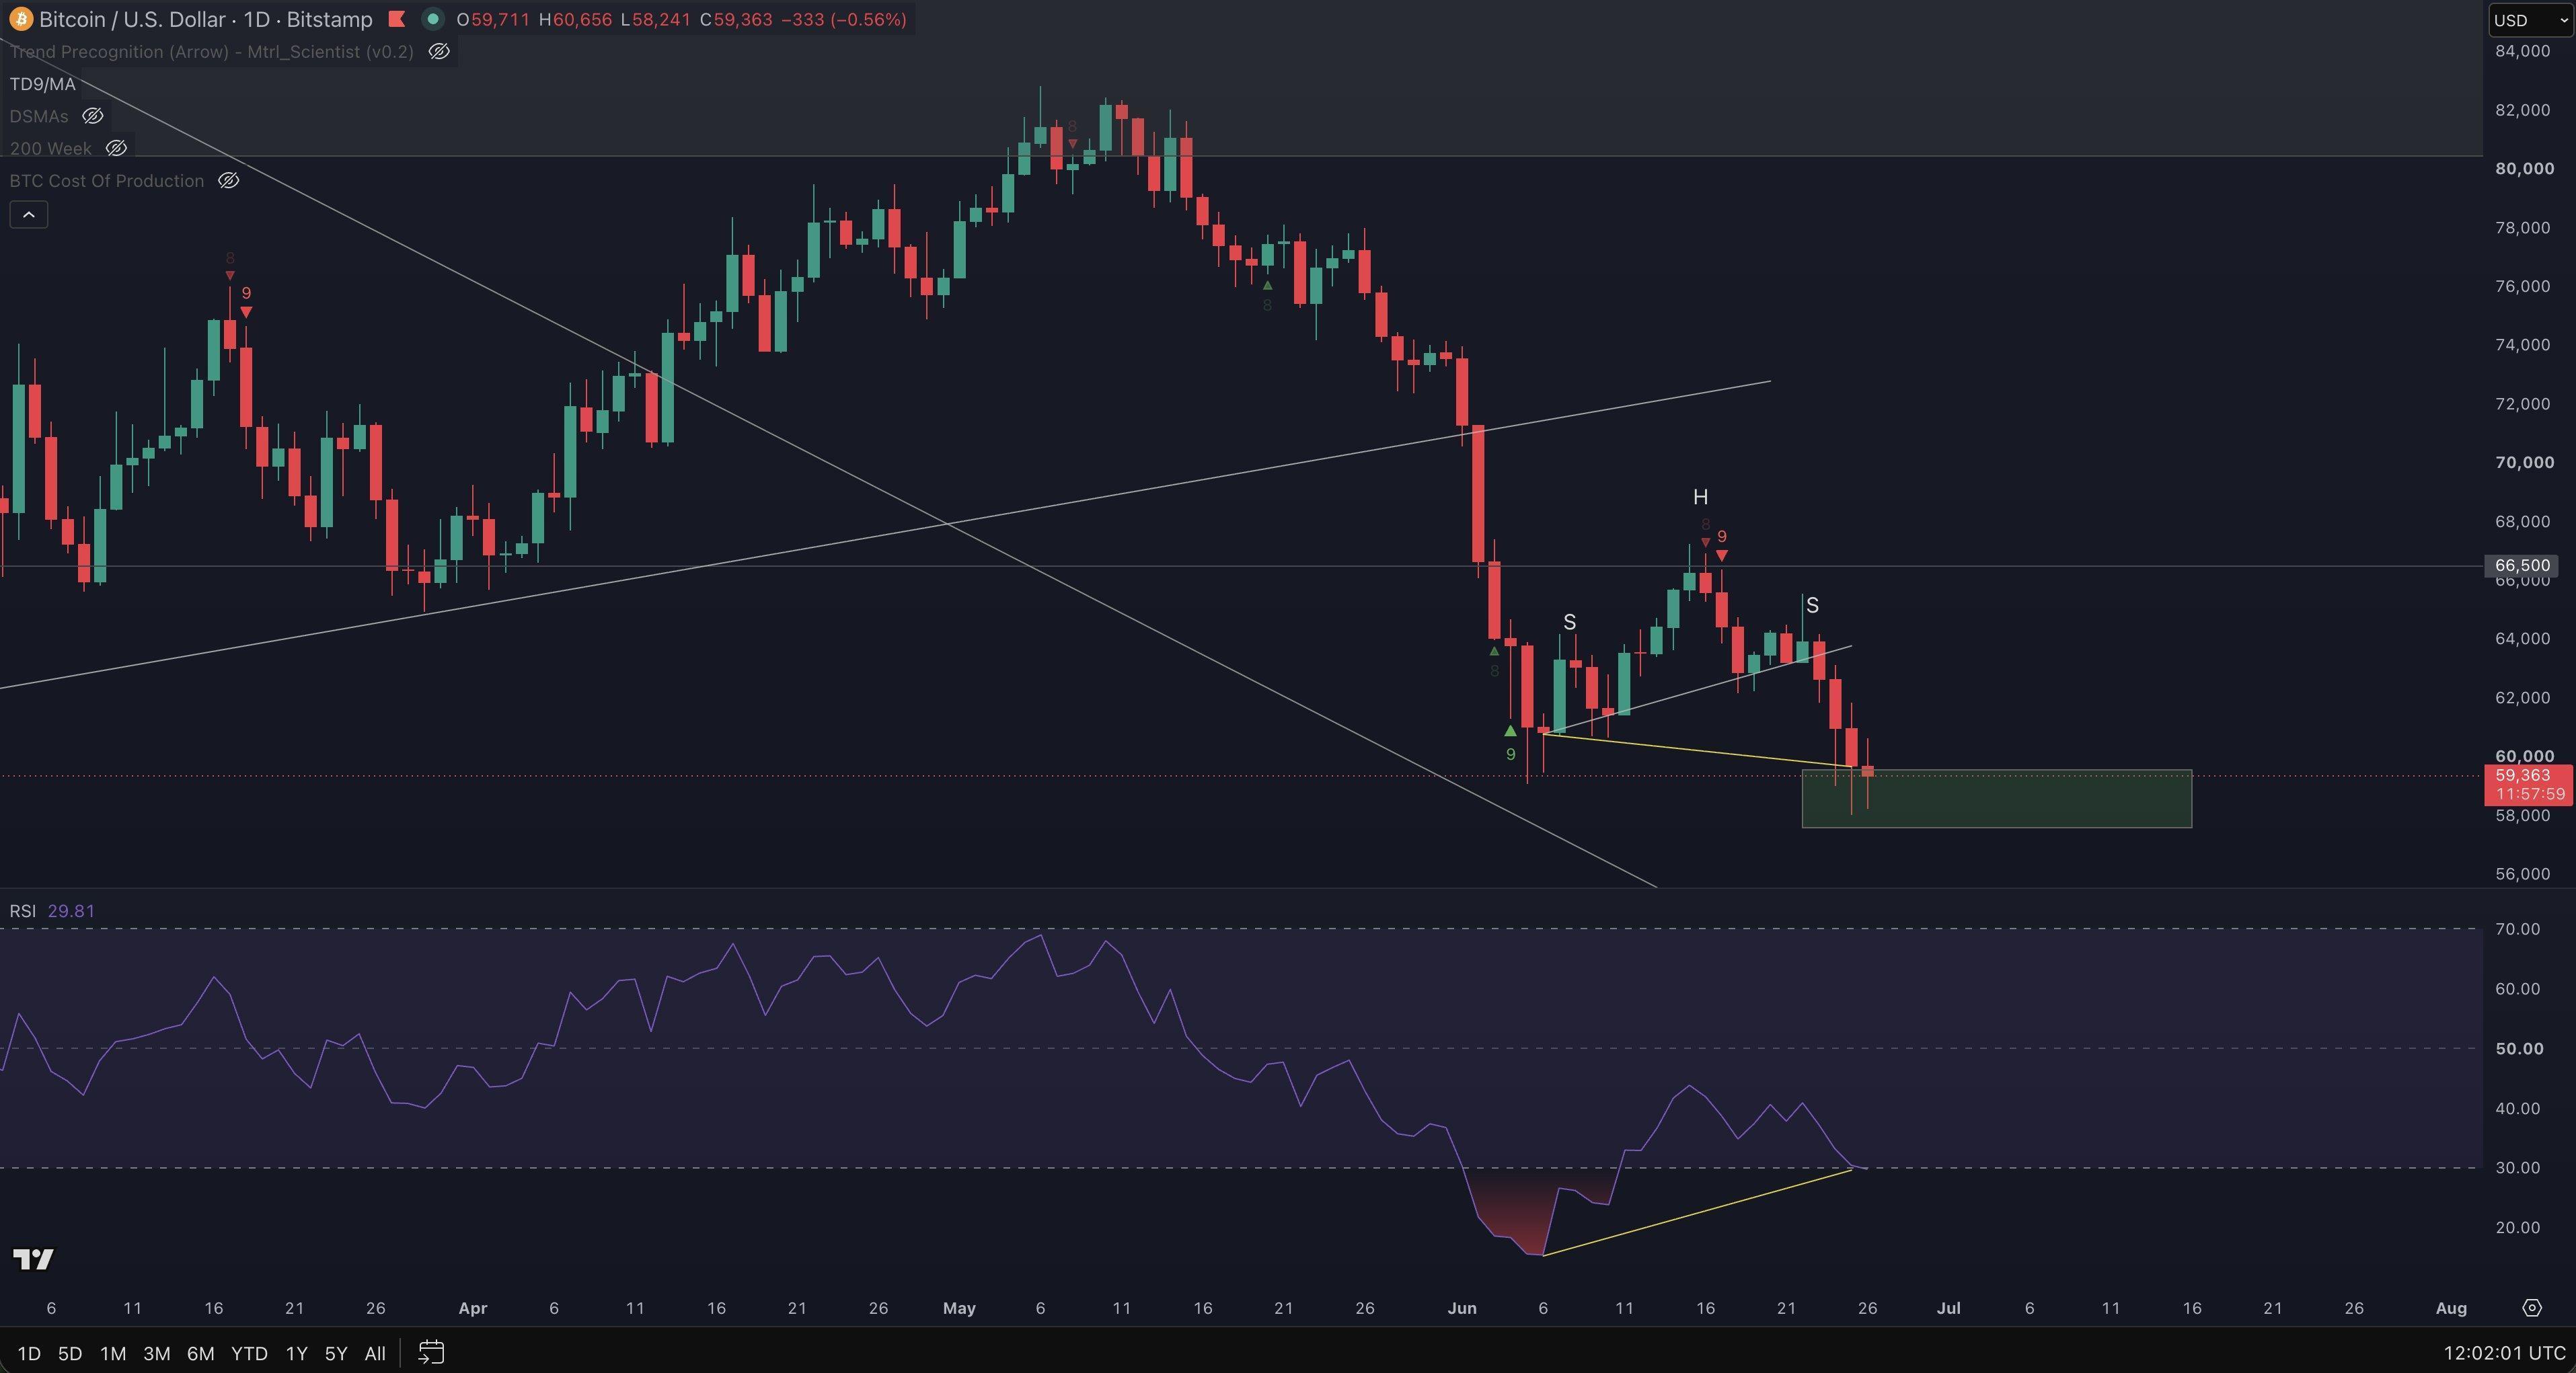
BTC/USD one-day chart. Source: Lukasz Wydra/X
New BTC price lows remain popular target
Other traders stuck to existing predictions of further downside pressure entering sooner or later.
Related: BTC price four-year trend calls for $76K as analysis says Bitcoin 'not broken'
Niels Klaver, cofounder of crypto platform STABL Agency, repeated calls for a trip to $55,000 “before any big move” to change the status quo.
BTC/USD comparison. Source: Niels Klaver/X
Trader and analyst Rekt Capital suggested that a relief bounce could characterize the market next month thanks to July typically contrasting with June price action.
Once it confirmed the 50-month exponential moving average (EMA) as new resistance, BTC/USD would then see “August cancellation of relief and additional downside due to $60k weakening as support,” he wrote this week.
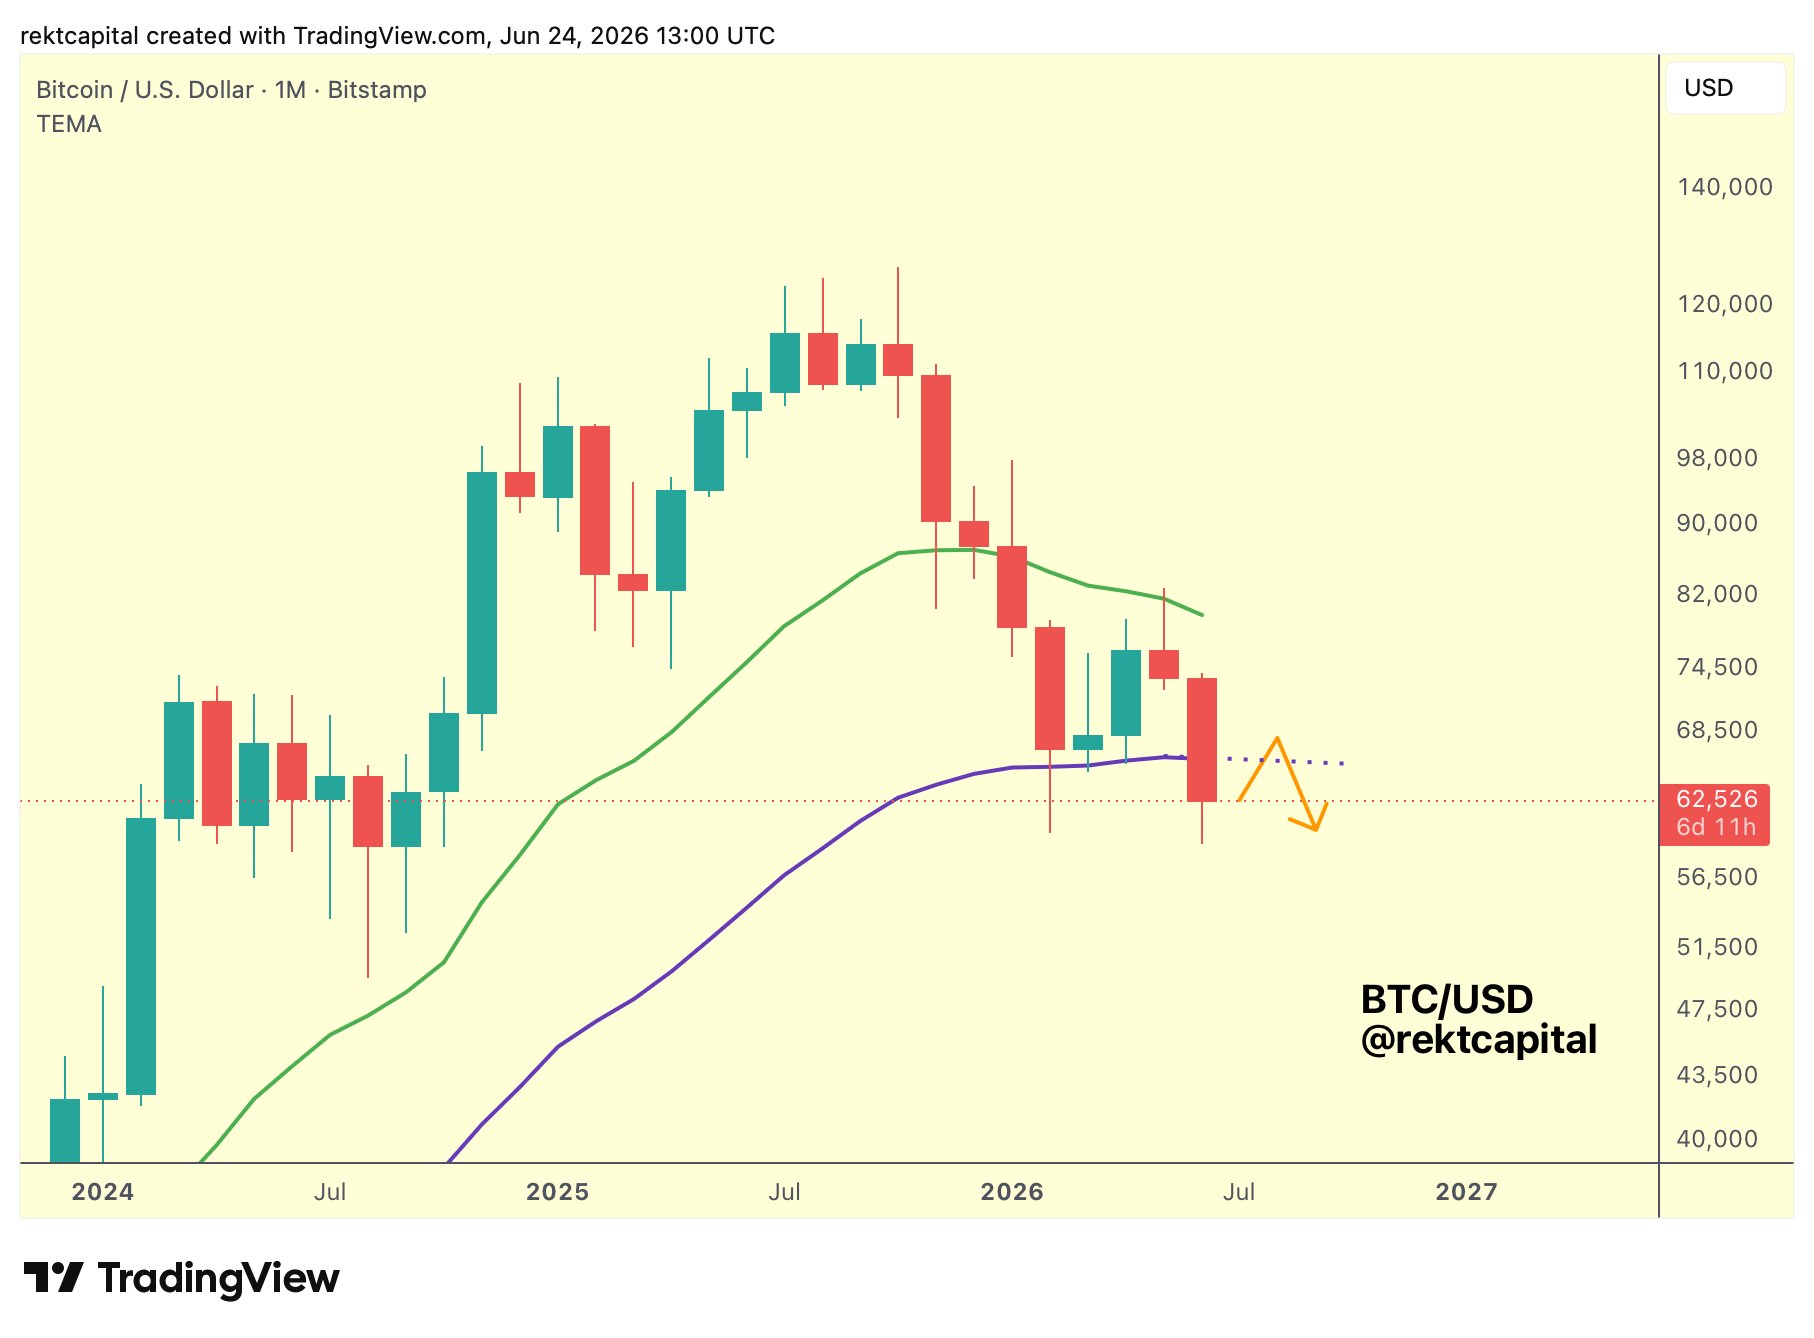
BTC/USD one-month chart with 21, 50EMA. Source: Rekt Capital/X
Disclaimer: The content of this article solely reflects the author's opinion and does not represent the platform in any capacity. This article is not intended to serve as a reference for making investment decisions.
You may also like

Pioneering zk-rollup Loopring closes DEX, citing lack of adoption

Ansem’s ANSEM Token Holdings Top $71 Million as Price Rallies
