
Coca-Cola Stock Clears All Major EMAs: Is a Breakout to $85 Next?

Coca-Cola stock is pressing against the upper end of its daily Bollinger Band, trading at $82.63. KO has cleared all three major EMAs on the daily chart, with price well above the EMA200 at $75.64. The stacked alignment reflects sustained, accumulation-driven demand rather than a short-lived bounce.
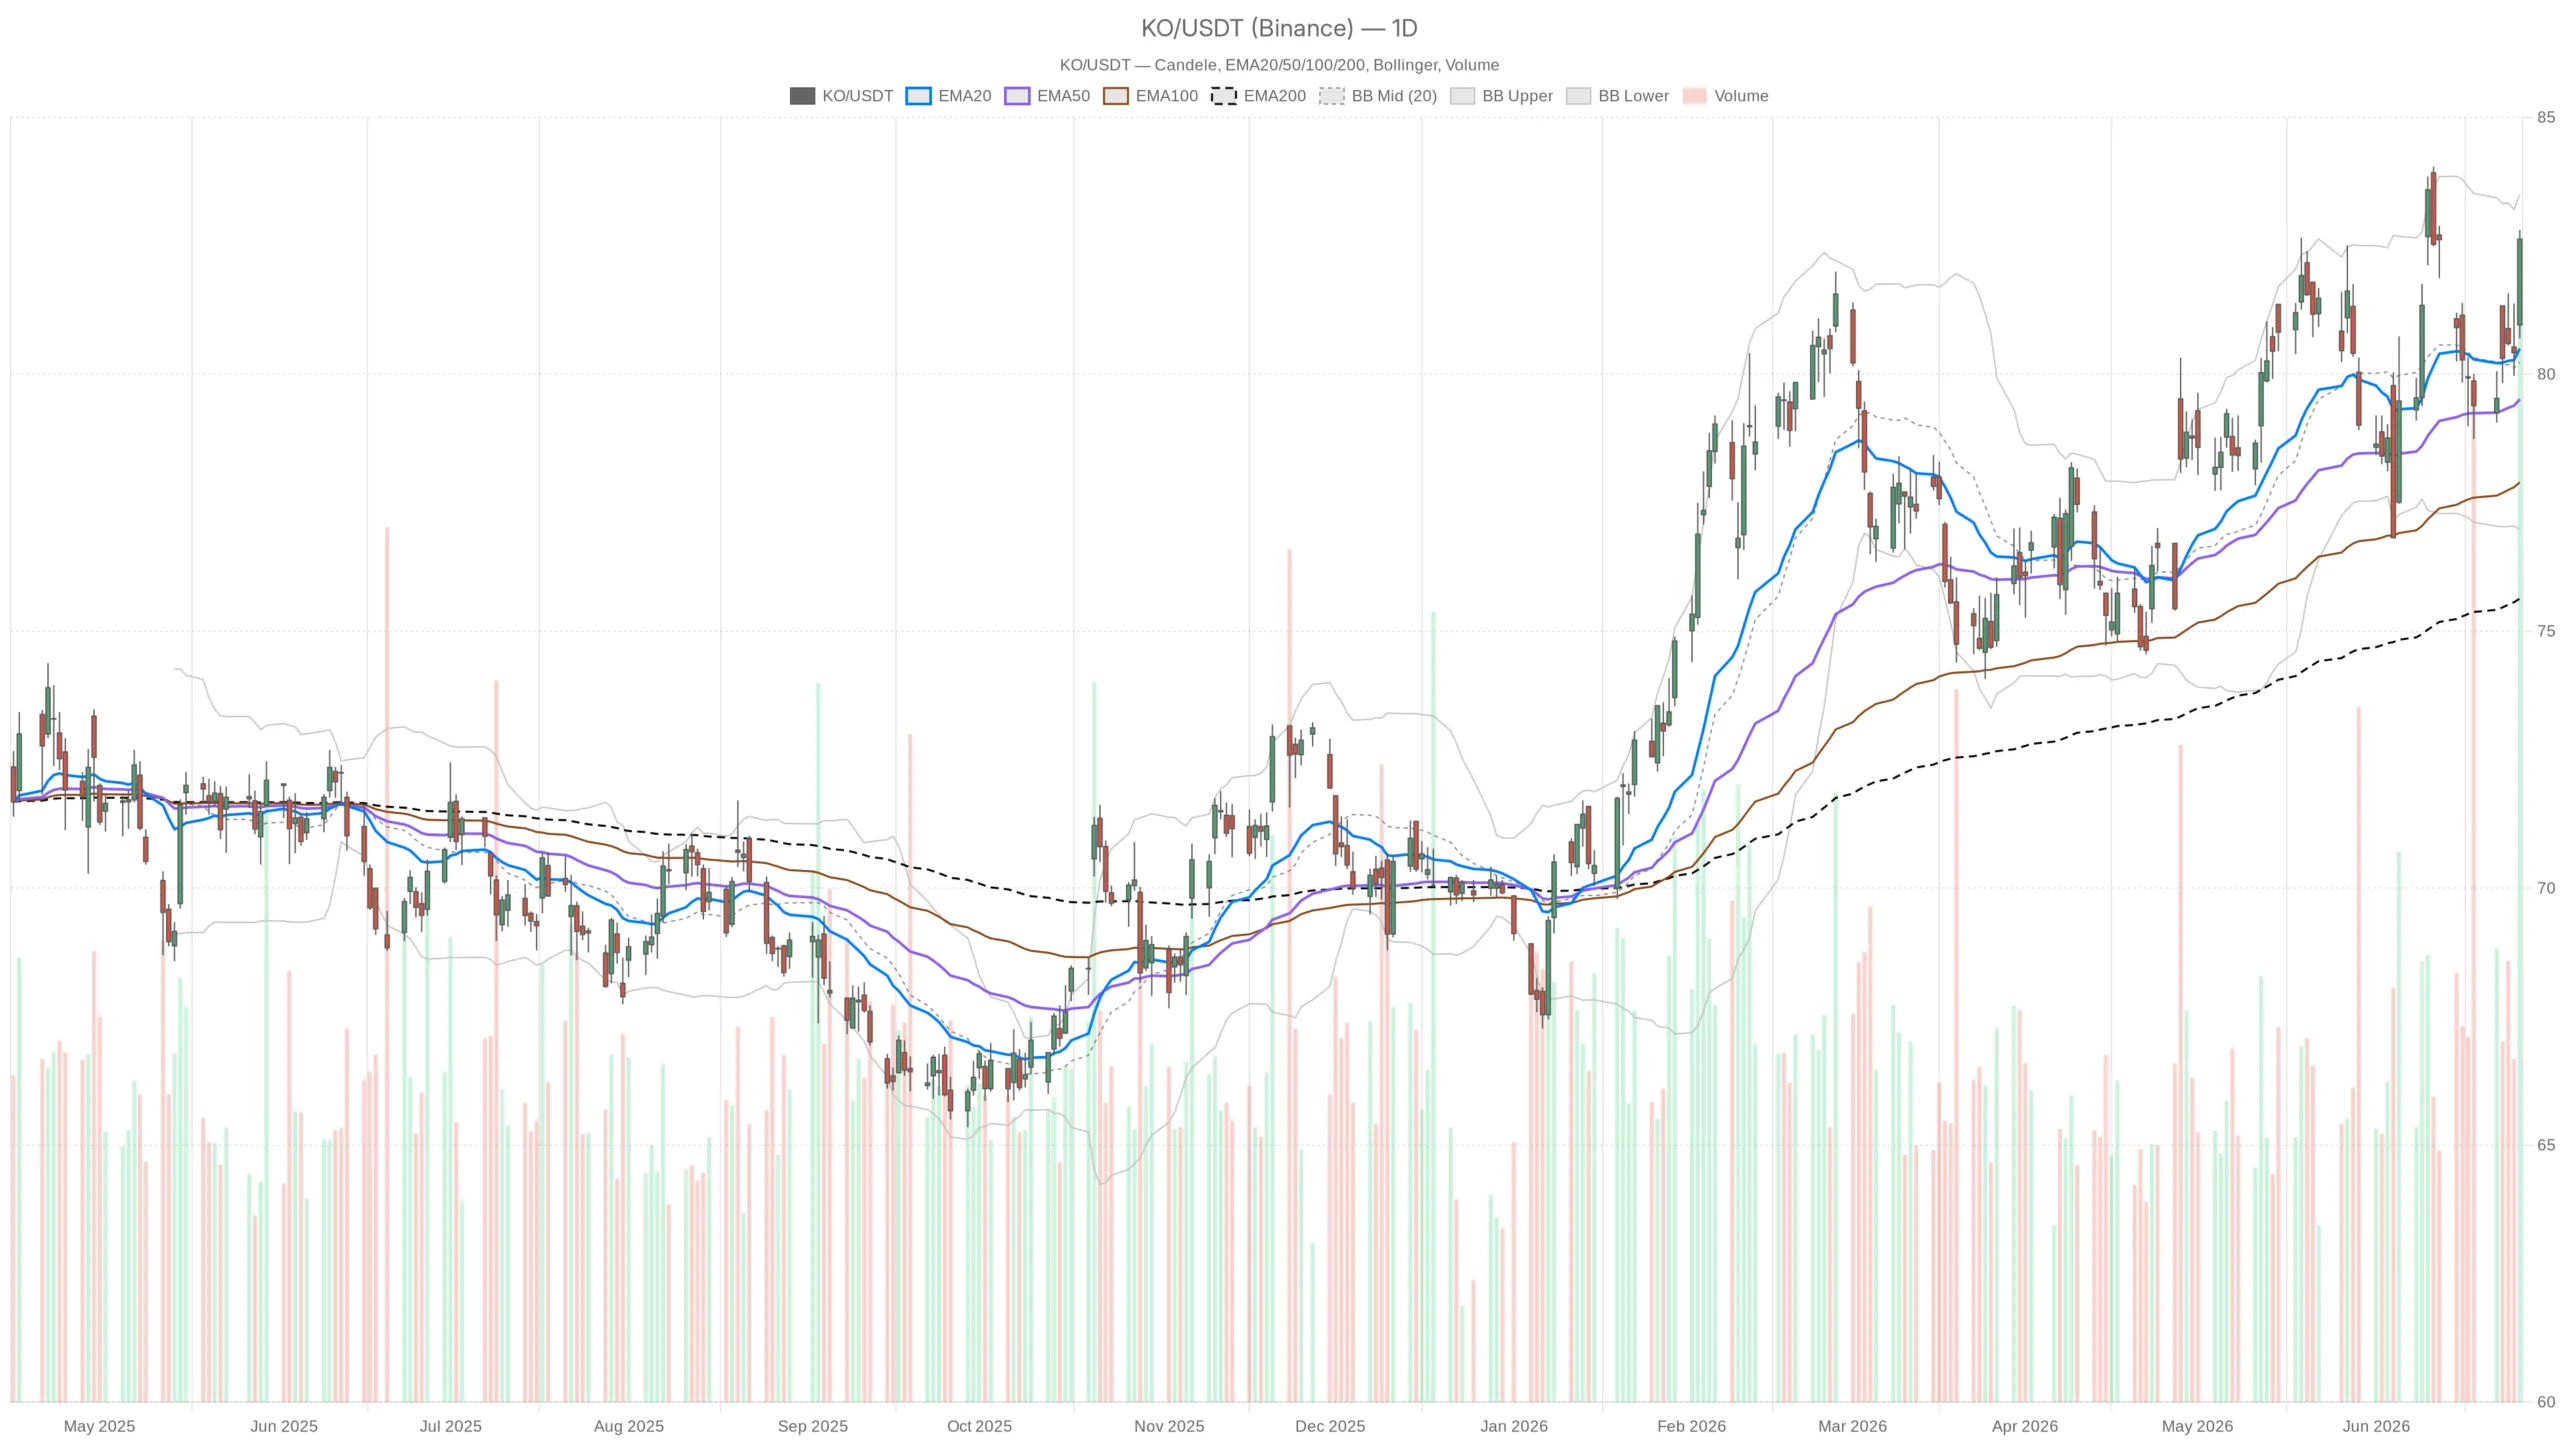 KO — daily chart with candlesticks, EMA20/EMA50 and volume.
Summary
- Key takeaways
- Daily Chart Confirms Bullish Structure for Coca-Cola Stock
- Volatility and Key Levels to Watch
- Short-Term Timeframes Flash Overbought Signals
- Fundamental Backdrop Reinforces Coca-Cola Stock’s Defensive Appeal
- Competitive Risks on the Horizon
- Scenarios: Bullish Breakout vs. Bearish Fade for Coca-Cola Stock
- FAQ
Key takeaways
- KO trades at $82.63, with price above all three daily EMAs — a high-conviction bullish alignment across timeframes.
- Daily RSI at 60.66 leaves room before overbought, while the MACD remains positive at 0.03.
- Hourly RSI at 71.25 signals short-term overbought conditions, suggesting a consolidation phase may be near.
- A sustained close above the daily Bollinger Band upper at $83.50 would confirm a breakout toward the $84–$85 range.
- Berkshire Hathaway’s dividend windfall and KO’s top growth-grade ranking among consumer staples reinforce fundamental support.
Daily Chart Confirms Bullish Structure for Coca-Cola Stock
KO’s daily chart displays an unambiguous bullish structure, supported by a clean EMA alignment and constructive momentum readings. The broader price structure leaves little doubt about the prevailing direction.
KO has cleared all three major exponential moving averages on the daily chart. Price sits well above the EMA200 at $75.64, the EMA50 at $79.52, and the EMA20 at $80.50. That kind of stacked alignment rarely happens by accident. It reflects sustained, accumulation-driven demand.
The daily RSI at 60.66 keeps momentum in constructive territory without signaling exhaustion. There is room left before overbought conditions become a real concern. Meanwhile, the MACD histogram shows a slim but positive reading of 0.03. The MACD line sits marginally above its signal. The move is not explosive, but the trend is coherent and intact.
That combination defines a market in a healthy uptrend, not a parabolic one. A clean EMA stack, RSI in the 60s, and a positive MACD all point in the same direction.
Volatility and Key Levels to Watch
The immediate ceiling sits at the daily Bollinger Band upper of $83.50, while support rests at the pivot point of $82.05 and S1 at $81.28. These levels frame the near-term risk-reward equation for Coca-Cola stock.
Volatility on the daily frame remains controlled. The ATR14 of 1.62 against a price near $82.63 implies relatively modest daily swings for a large-cap consumer staples name. Price closed at $82.63 on June 26, just below the upper Bollinger Band.
A clean break and close above $83.50 would open the door to the R1 pivot at $83.39 and potentially beyond. On the downside, the pivot point at $82.05 and S1 at $81.28 represent the first meaningful support zones on any intraday pullback.
Short-Term Timeframes Flash Overbought Signals
The hourly RSI at 71.25 has entered overbought territory, with price touching the upper Bollinger Band. This is a short-term caution flag that does not reverse the daily trend but warrants attention from active traders.
On the hourly timeframe, the picture broadly confirms the daily thesis — but with a caveat. Price is sitting directly at the upper Bollinger Band on the hourly chart. That combination signals that upward momentum may need to consolidate or pause before extending further.
However, the hourly MACD remains firmly positive, with the histogram at 0.20 and the line well above the signal. That internal strength limits the risk of a sharp reversal from this zone. The 1H EMA structure mirrors the daily setup. All three EMAs are stacked bullishly at 81.26, 80.80, and 80.25 respectively. Price trades above all of them — a high-conviction alignment across both major timeframes.
Therefore, the most probable near-term path is a brief consolidation or minor retracement, rather than a trend reversal.
15-Minute Execution Context
At the 15-minute level, the RSI has pushed to 74.15, and price is testing the upper Bollinger Band at $82.75. This is purely an execution context signal. It tells short-term traders that the immediate entry point is stretched.
Still, the MACD on this frame remains positive, and the micro regime is still classified as bullish. Any 15-minute pullback toward the $82.15 support zone — the S1 pivot shared across both the 1H and 15m frames — would represent a cleaner risk-entry setup for those looking to trade with the prevailing trend.
Fundamental Backdrop Reinforces Coca-Cola Stock’s Defensive Appeal
Berkshire Hathaway’s compounding dividend windfall and KO’s top growth-grade ranking among consumer staples have drawn steady institutional and retail buyers. These fundamentals provide a durable tailwind beyond the technical setup.
Recent market commentary has reinforced KO’s structural appeal. Berkshire Hathaway’s legendary Coca-Cola dividend windfall has attracted renewed retail and institutional attention. Even Elon Musk flagged the compounding power of the position. A separate analysis ranking S&P 500 consumer staples by growth grades placed KO near the top alongside Monster Beverage.
In a period where macro fears have rattled momentum names, Coca-Cola’s defensive beverage margins and consistent dividend profile have drawn steady buyers. Softening jobs data, decelerating GDP, and record consumer debt levels have all pressured risk assets. Yet one widely circulated piece noted continued accumulation of KO stock even as broader consumer sentiment weakened.
Competitive Risks on the Horizon
Target’s addition of Coca-Cola rivals and PepsiCo’s entry into adjacent beverage segments represent gradual consumer preference shifts worth monitoring. These are not immediate threats but signal evolving shelf dynamics.
The competitive landscape deserves attention. Target’s addition of a Coca-Cola rival in the form of “dirty soda” formats reflects an evolving retail beverage shelf. PepsiCo has also entered the ready-to-drink dirty soda segment. However, these are not immediate threats to KO’s core volumes. They signal a gradual shift in consumer preference that the company will need to address.
Product innovation and shelf-space defense will be critical over the medium term to maintain KO’s dominant market position.
Scenarios: Bullish Breakout vs. Bearish Fade for Coca-Cola Stock
The bullish scenario triggers on a sustained close above $83.50, while the bearish case gains credibility on a breakdown below $82.05. Both scenarios are actionable depending on how price resolves the current compression zone.
The bullish scenario rests on a straightforward trigger. A sustained close above the daily Bollinger Band upper at $83.50 would confirm the breakout and shift focus toward the $84–$85 range. Continued institutional buying provides the fundamental catalyst to sustain that move. KO’s dividend king status and top growth-grade ranking among consumer staples reinforce the bullish case.
On the other hand, the bearish case would gain credibility if price fails to hold above the daily pivot at $82.05 on a closing basis. A breakdown through $81.28 would indicate that the recent push to highs was a distribution zone rather than a launching pad. At the same time, the hourly overbought RSI and price touching upper Bollinger Bands across multiple timeframes present a real risk of a short-term fade.
If macro sentiment deteriorates sharply — particularly on credit or consumer spending data — even defensive staples like KO could experience forced selling.
Overall, Coca-Cola stock enters this stretch with a firmly bullish daily structure, multi-timeframe EMA alignment, and constructive momentum. The near-term risk is a short consolidation as hourly and 15-minute indicators reach stretched levels. Positioning with the trend remains supported by the evidence. However, entry timing is critical given how extended the short-term frames appear. Volatility remains low by historical standards, which cuts both ways. It limits downside panic, but it also caps explosive upside moves. This is a market where patience and level-based execution matter more than conviction alone.
FAQ
Is Coca-Cola stock a buy right now?
KO’s daily structure is firmly bullish, but hourly and 15-minute RSI readings are overbought. A pullback toward the $82.15–$81.28 support zone would offer a cleaner risk-entry setup for trend-following traders.
What are the key resistance levels for KO?
The immediate resistance is the daily Bollinger Band upper at $83.50. Above that, the R1 pivot at $83.39 and the $84–$85 range become the next upside targets for Coca-Cola stock.
What support levels should traders watch?
Key support sits at the daily pivot of $82.05, followed by S1 at $81.28. A close below $82.05 would weaken the near-term bullish case and shift attention to lower supports.
What makes Coca-Cola stock attractive in the current macro environment?
KO benefits from defensive beverage margins, a consistent dividend profile, and a top growth-grade ranking among S&P 500 consumer staples. These factors have attracted steady buyers even as broader consumer sentiment has weakened and macro uncertainty persists.
{"@context":"https://schema.org","@type":"FAQPage","mainEntity":[{"@type":"Question","name":"Is Coca-Cola stock a buy right now?","acceptedAnswer":{"@type":"Answer","text":"KO's daily structure is firmly bullish, but hourly and 15-minute RSI readings are overbought. A pullback toward the $82.15–$81.28 support zone would offer a cleaner risk-entry setup for trend-following traders."}},{"@type":"Question","name":"What are the key resistance levels for KO?","acceptedAnswer":{"@type":"Answer","text":"The immediate resistance is the daily Bollinger Band upper at $83.50. Above that, the R1 pivot at $83.39 and the $84–$85 range become the next upside targets for Coca-Cola stock."}},{"@type":"Question","name":"What support levels should traders watch?","acceptedAnswer":{"@type":"Answer","text":"Key support sits at the daily pivot of $82.05, followed by S1 at $81.28. A close below $82.05 would weaken the near-term bullish case and shift attention to lower supports."}},{"@type":"Question","name":"What makes Coca-Cola stock attractive in the current macro environment?","acceptedAnswer":{"@type":"Answer","text":"KO benefits from defensive beverage margins, a consistent dividend profile, and a top growth-grade ranking among S&P 500 consumer staples. These factors have attracted steady buyers even as broader consumer sentiment has weakened and macro uncertainty persists."}}]}
Disclaimer: The content of this article solely reflects the author's opinion and does not represent the platform in any capacity. This article is not intended to serve as a reference for making investment decisions.
You may also like
Strategy announces $1B repurchase program for digital credit securities
ORE surpasses 3 million SOL deployed for mining since V3 launch
XRP Ledger Sandwich Attack Risk: Ripple EX CTO Proposes a Fix
Eurozone: Heatwaves add macro risk for growth – ING