

In brief
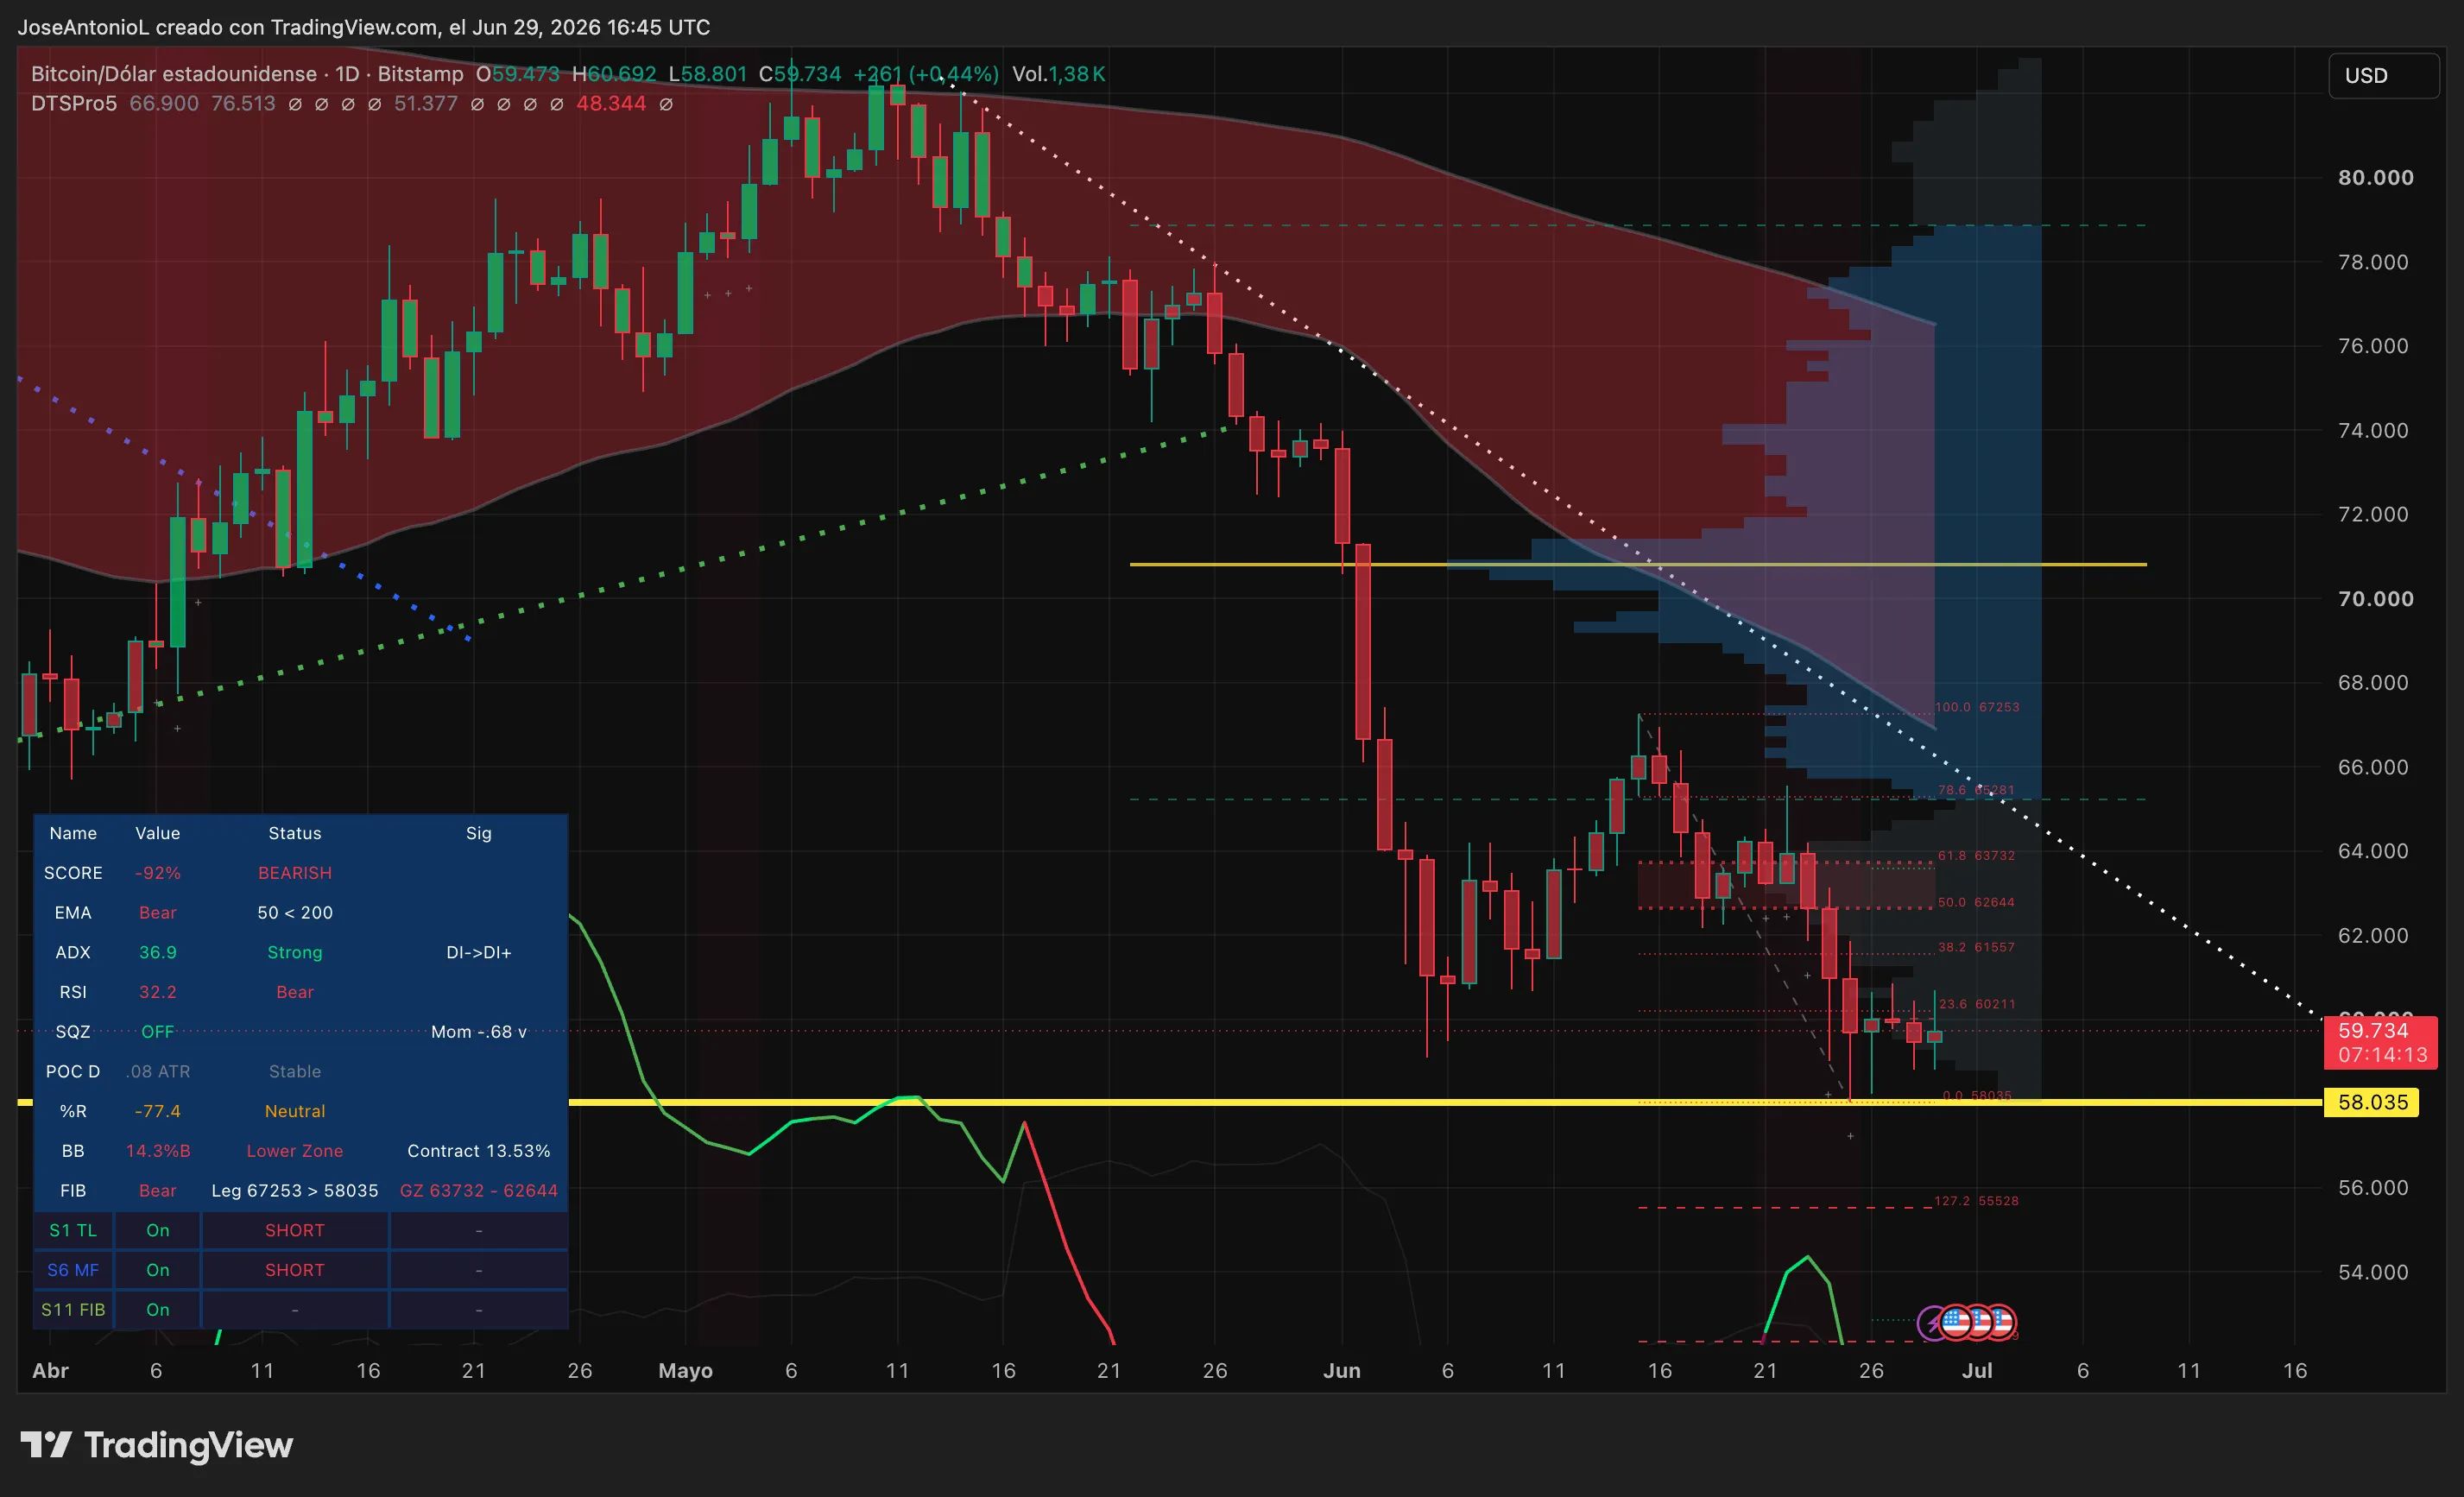
- The Bitcoin daily price chart shows an RSI of 34, ADX of 36.9 trending bearish, a death-cross EMA setup, showing an organized decline.
- The $58,035 support level held on Monday's intra-day dip to $58,801. It may not get many more chances.
- On Myriad, traders say there's an 80% Bitcoin price dumps before any market rebound.
Wall Street turned green today—Nasdaq up 1.4%, S&P 500 up 0.8%—after the Supreme Court blocked Trump's attempt to fire Federal Reserve governor Lisa Cook and a U.S.-Iran ceasefire reduced tensions near the Strait of Hormuz.
Risk assets rallied, but Bitcoin barely noticed. BTC is down roughly 53% from its October 2025 all-time high of $126,198 and just logged back-to-back quarterly losses resembling the 2022 bear market.
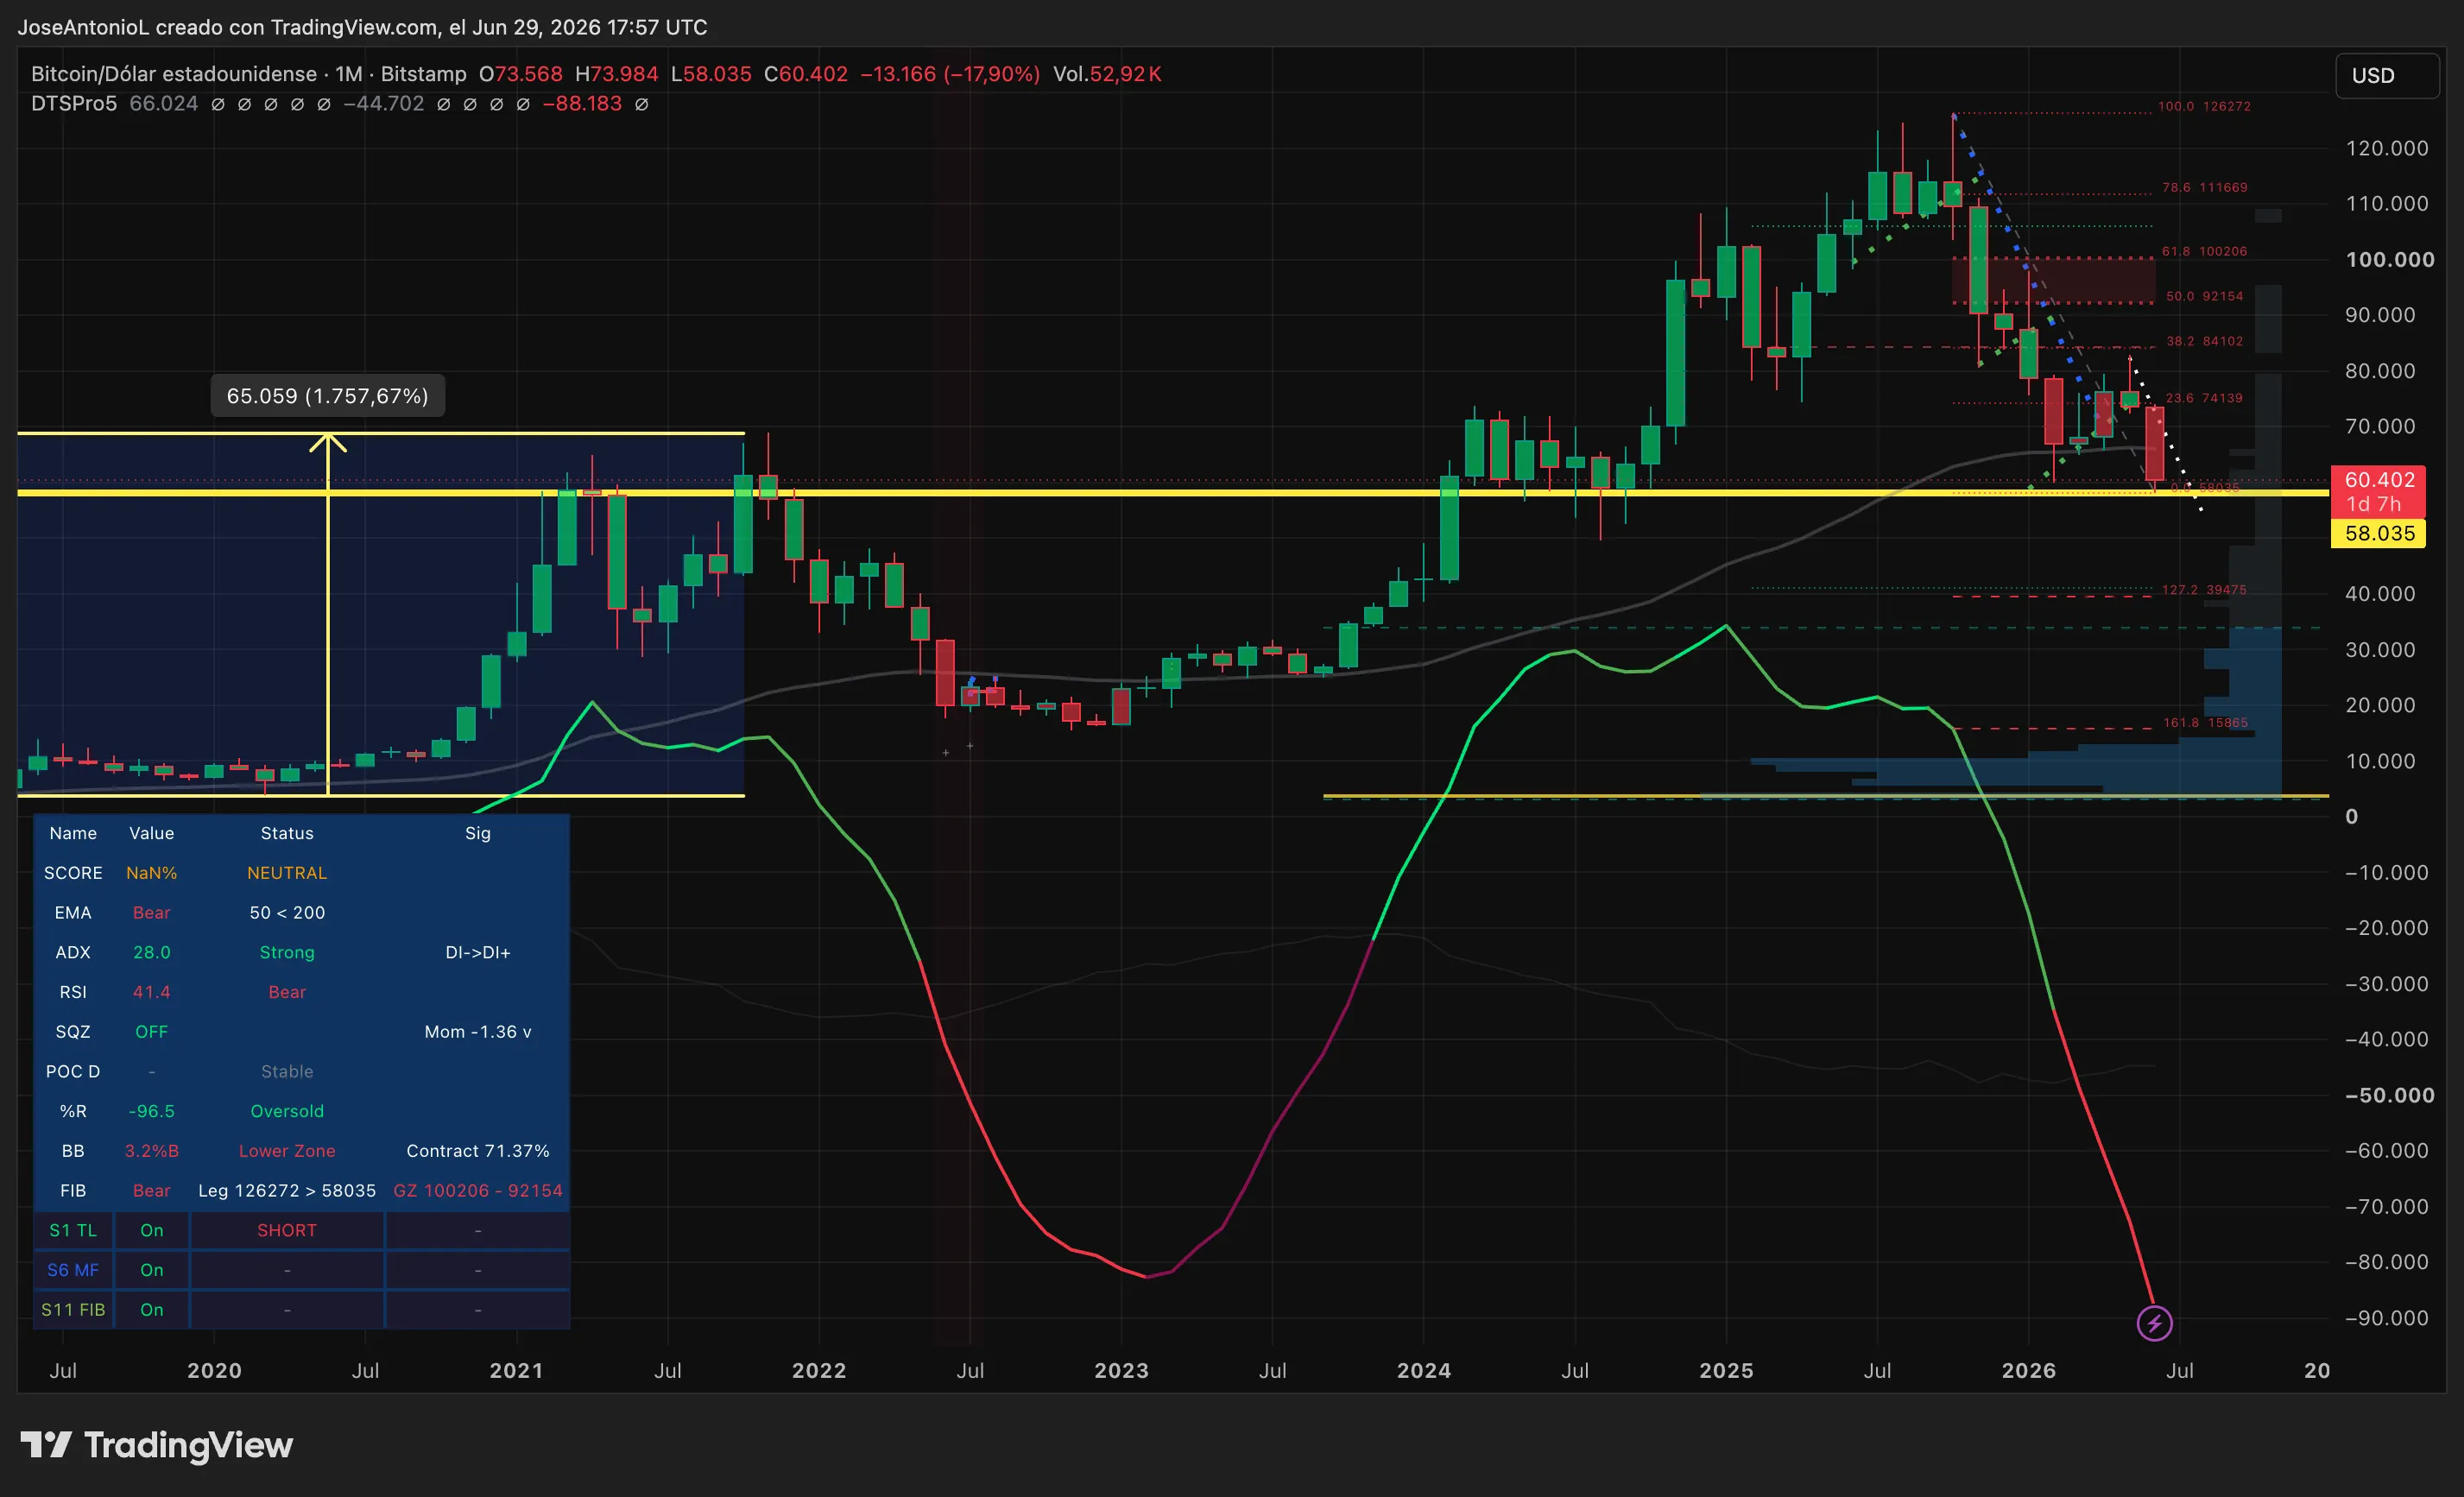 Bitcoin price data. Image: Tradingview
The macro backdrop isn't helping. Spot Bitcoin ETFs bled roughly $4 billion, stripping away the institutional bid that had cushioned earlier drawdowns. The Fed under Kevin Warsh remains hawkish—markets are pricing an 80% chance of a December rate hike.
Bitcoin price: What the daily chart is telling us
Bitcoin opened Monday at $59,473 on the daily chart, dipped to a session low of $58,801, then recovered to trade around $60,104—a +1.06% move.
That bounce wasn't random. The $58,035 level is the anchor of the entire bearish Fibonacci leg measured from the June high of $67,253, and it's been holding as a horizontal support line. Bulls stepped in near it today. The question is how many times they can keep doing that.
 Bitcoin price data. Image: Tradingview
The Average Directional Index, or ADX, reads 36.9 on the daily. ADX measures how strong a trend is—direction aside—and anything above 25 signals a genuine, committed trend is in place.
The RSI—the Relative Strength Index, which gauges buying and selling momentum on a 0 to 100 scale—sits at 34 on the daily. That's in bear territory, just above the 30 level that typically marks oversold conditions. An oversold reading can attract bargain hunters and spark a relief bounce, but at 34, Bitcoin hasn't hit that floor yet. The pressure is clearly downward.
The exponential moving average picture is uniformly bearish. The 50-day exponential moving average, or EMA, sits around $66,913—well above the current price, acting as overhead resistance. The 200-day EMA is even higher at approximately $76,517. When price trades below both moving averages with the 50 also below the 200—a configuration traders call a death cross—it signals the medium- and long-term trends are both pointing down. That's exactly what the daily chart is showing right now.
The bigger picture is harder to ignore. On Myriad, a prediction market created by Decrypt’s parent company Dastan, traders are pricing in an 80% chance Bitcoin dumps to $55K as opposed to pumping back to $84K.
Not great news for the permabullish crew.
Overall, considering Bitcoin is in a compression zone, the four-hour chart may seem a bit more interesting for traders with shorter time horizons. The price of Bitcoin has been compressing between roughly $59,200 and $60,400, and the Squeeze is still “on” at that timeframe with barely positive momentum (+0.26).
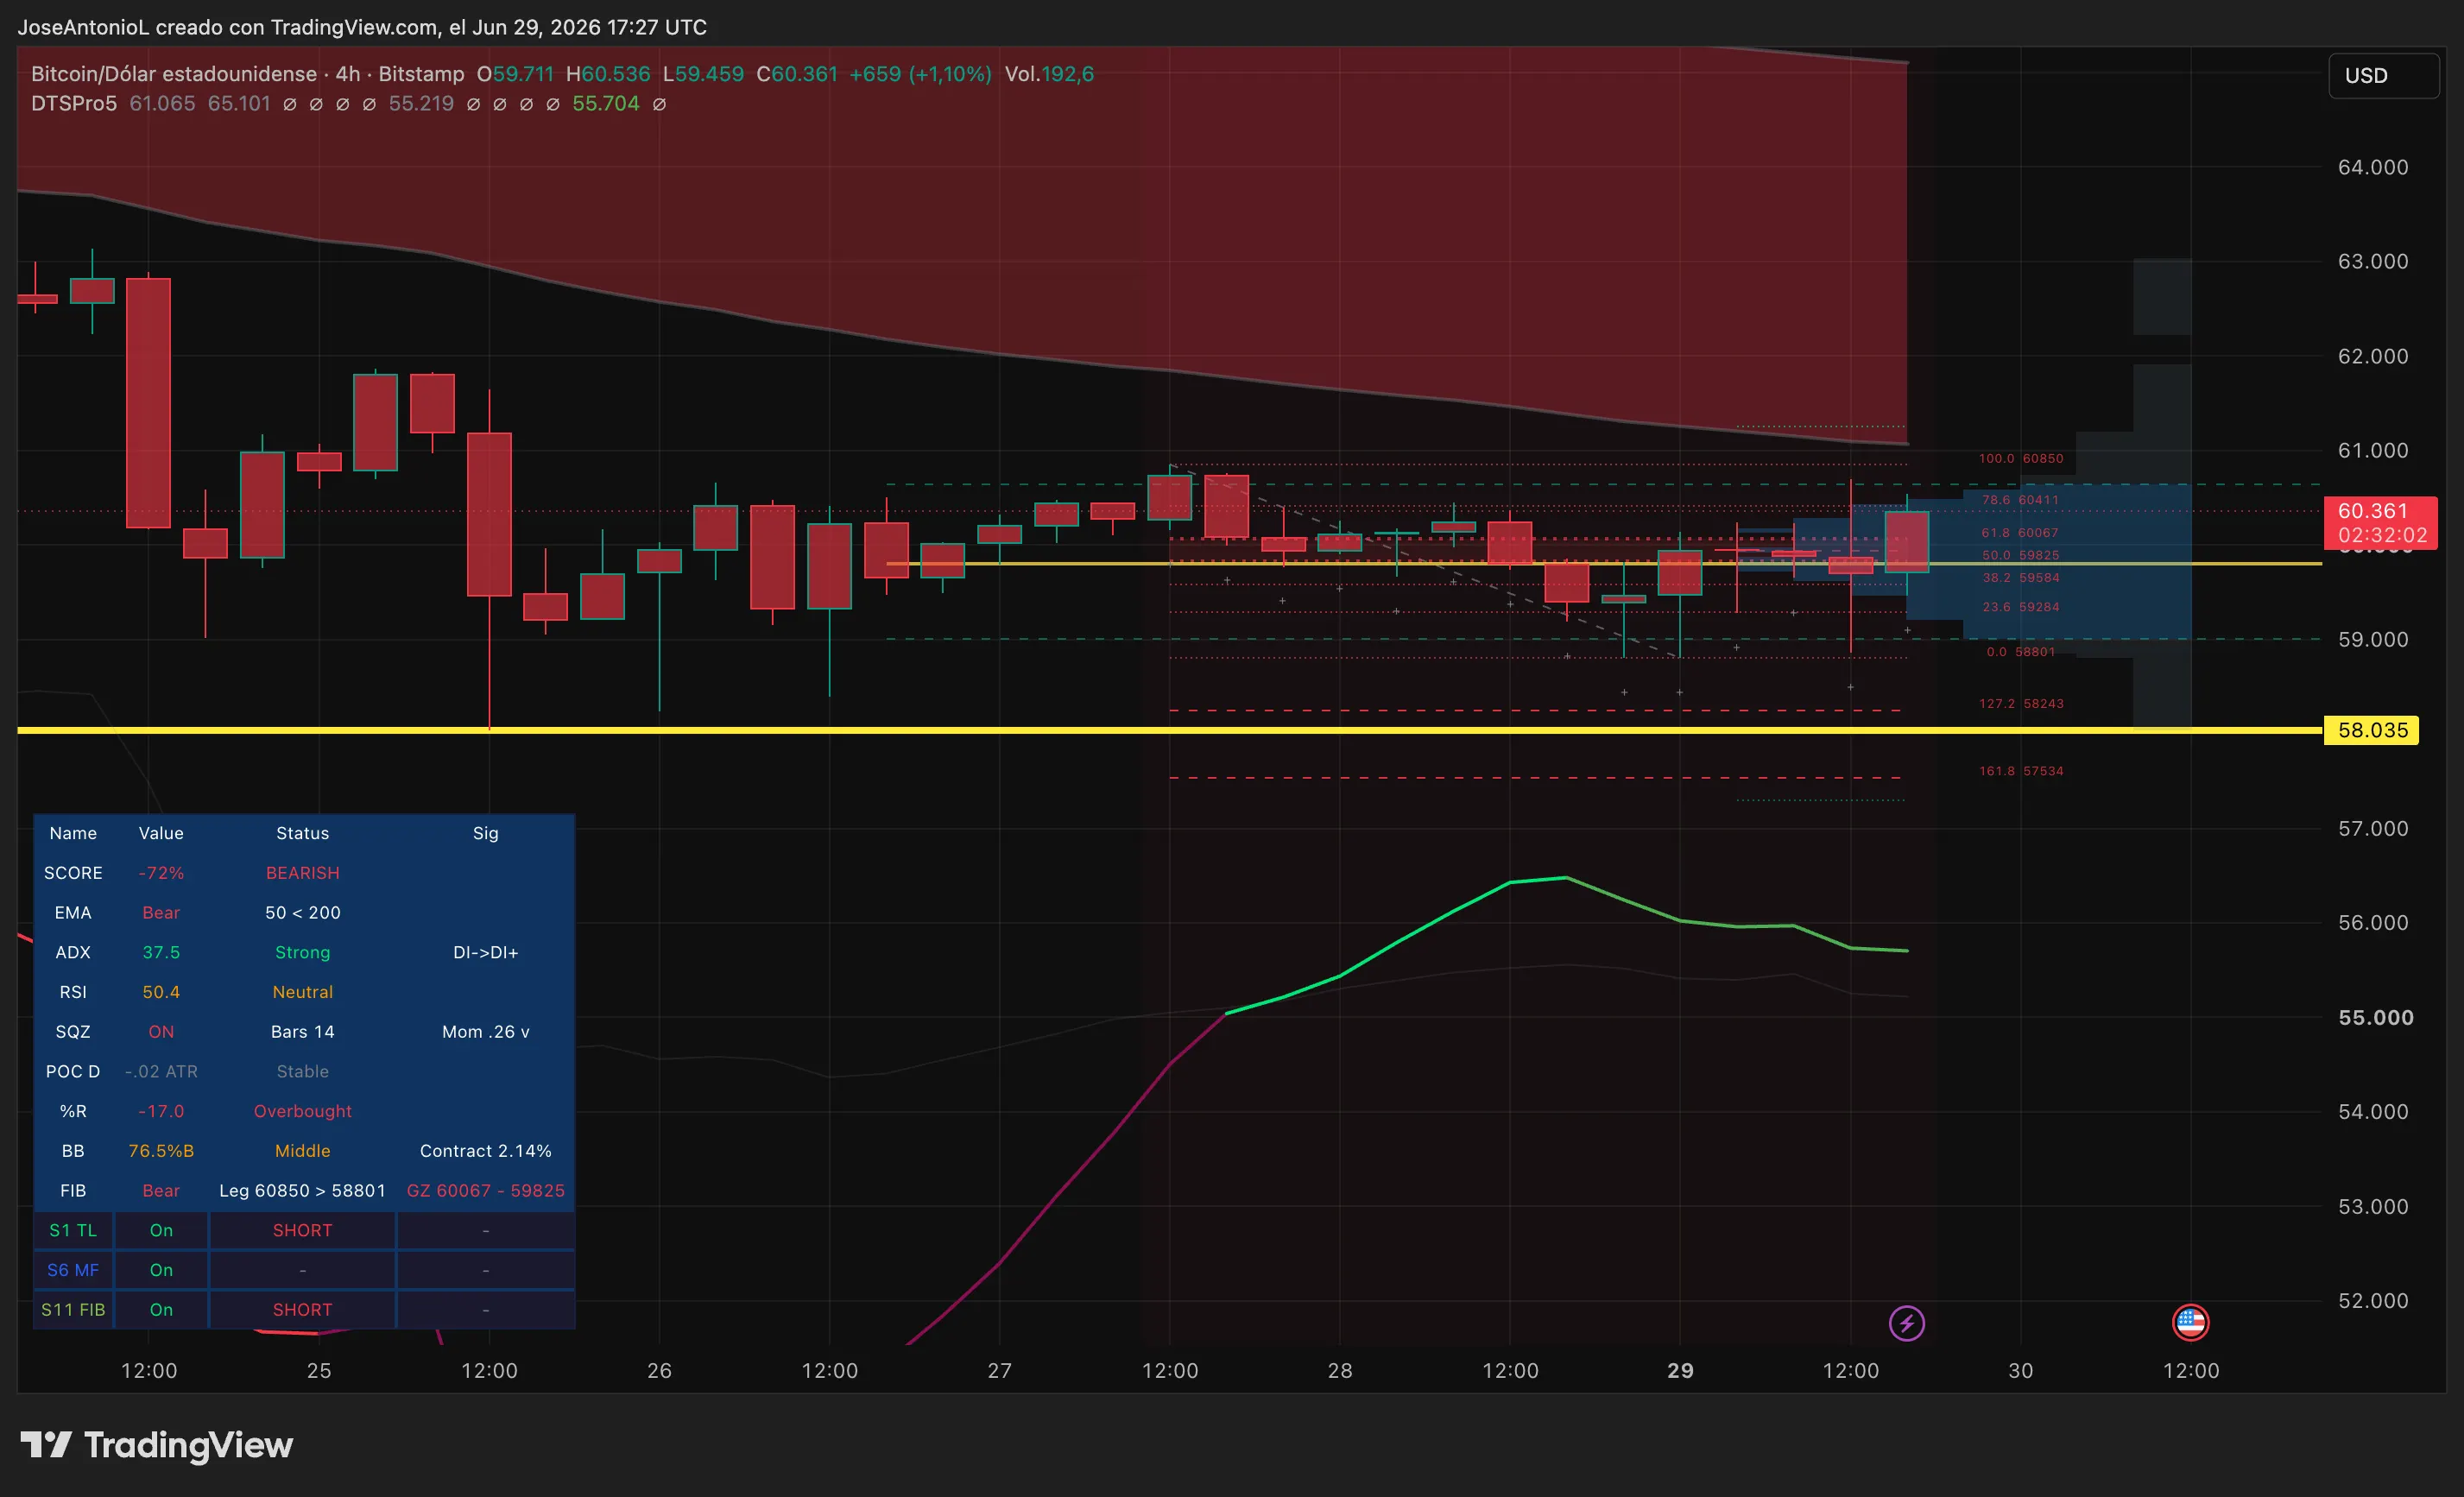 Bitcoin price data. Image: Tradingview
And this makes prices predictable as long as the compression remains. With 5x leverage, each round trip on that $1,200 band yields approximately 21.1% on reinvested capital—turning $1,000 into close to $2,000 over a few cycles with manageable risk. That's the trade while the compression holds. A break below $59,200 kills it immediately.
If $58,035 breaks, the daily chart offers no meaningful support until the $55,528 priceline —pretty close to the Myriad doom scenario. For the bulls, the first real target on any recovery is the Fibonacci Golden Zone between $62,644 and $63,732 on the daily, which would need to be reclaimed to even start talking about a trend reversal.
Above that sits the descending trendline around $65,000. Clear both, and the 50-day EMA at $66,913 comes into view—a level Bitcoin hasn't traded near in over a month.