
Oracle Stock Drops 19% to $147 — Worst Week Since the Dot-Com Bust

Oracle stock just suffered its worst weekly performance since August 2001, plunging 19% to close at $147.76 on June 29. ORCL remains trapped in a multi-month downtrend with no structural signs of reversal. The daily regime is unambiguously bearish, and oversold conditions offer only tactical relief — not a trend change.
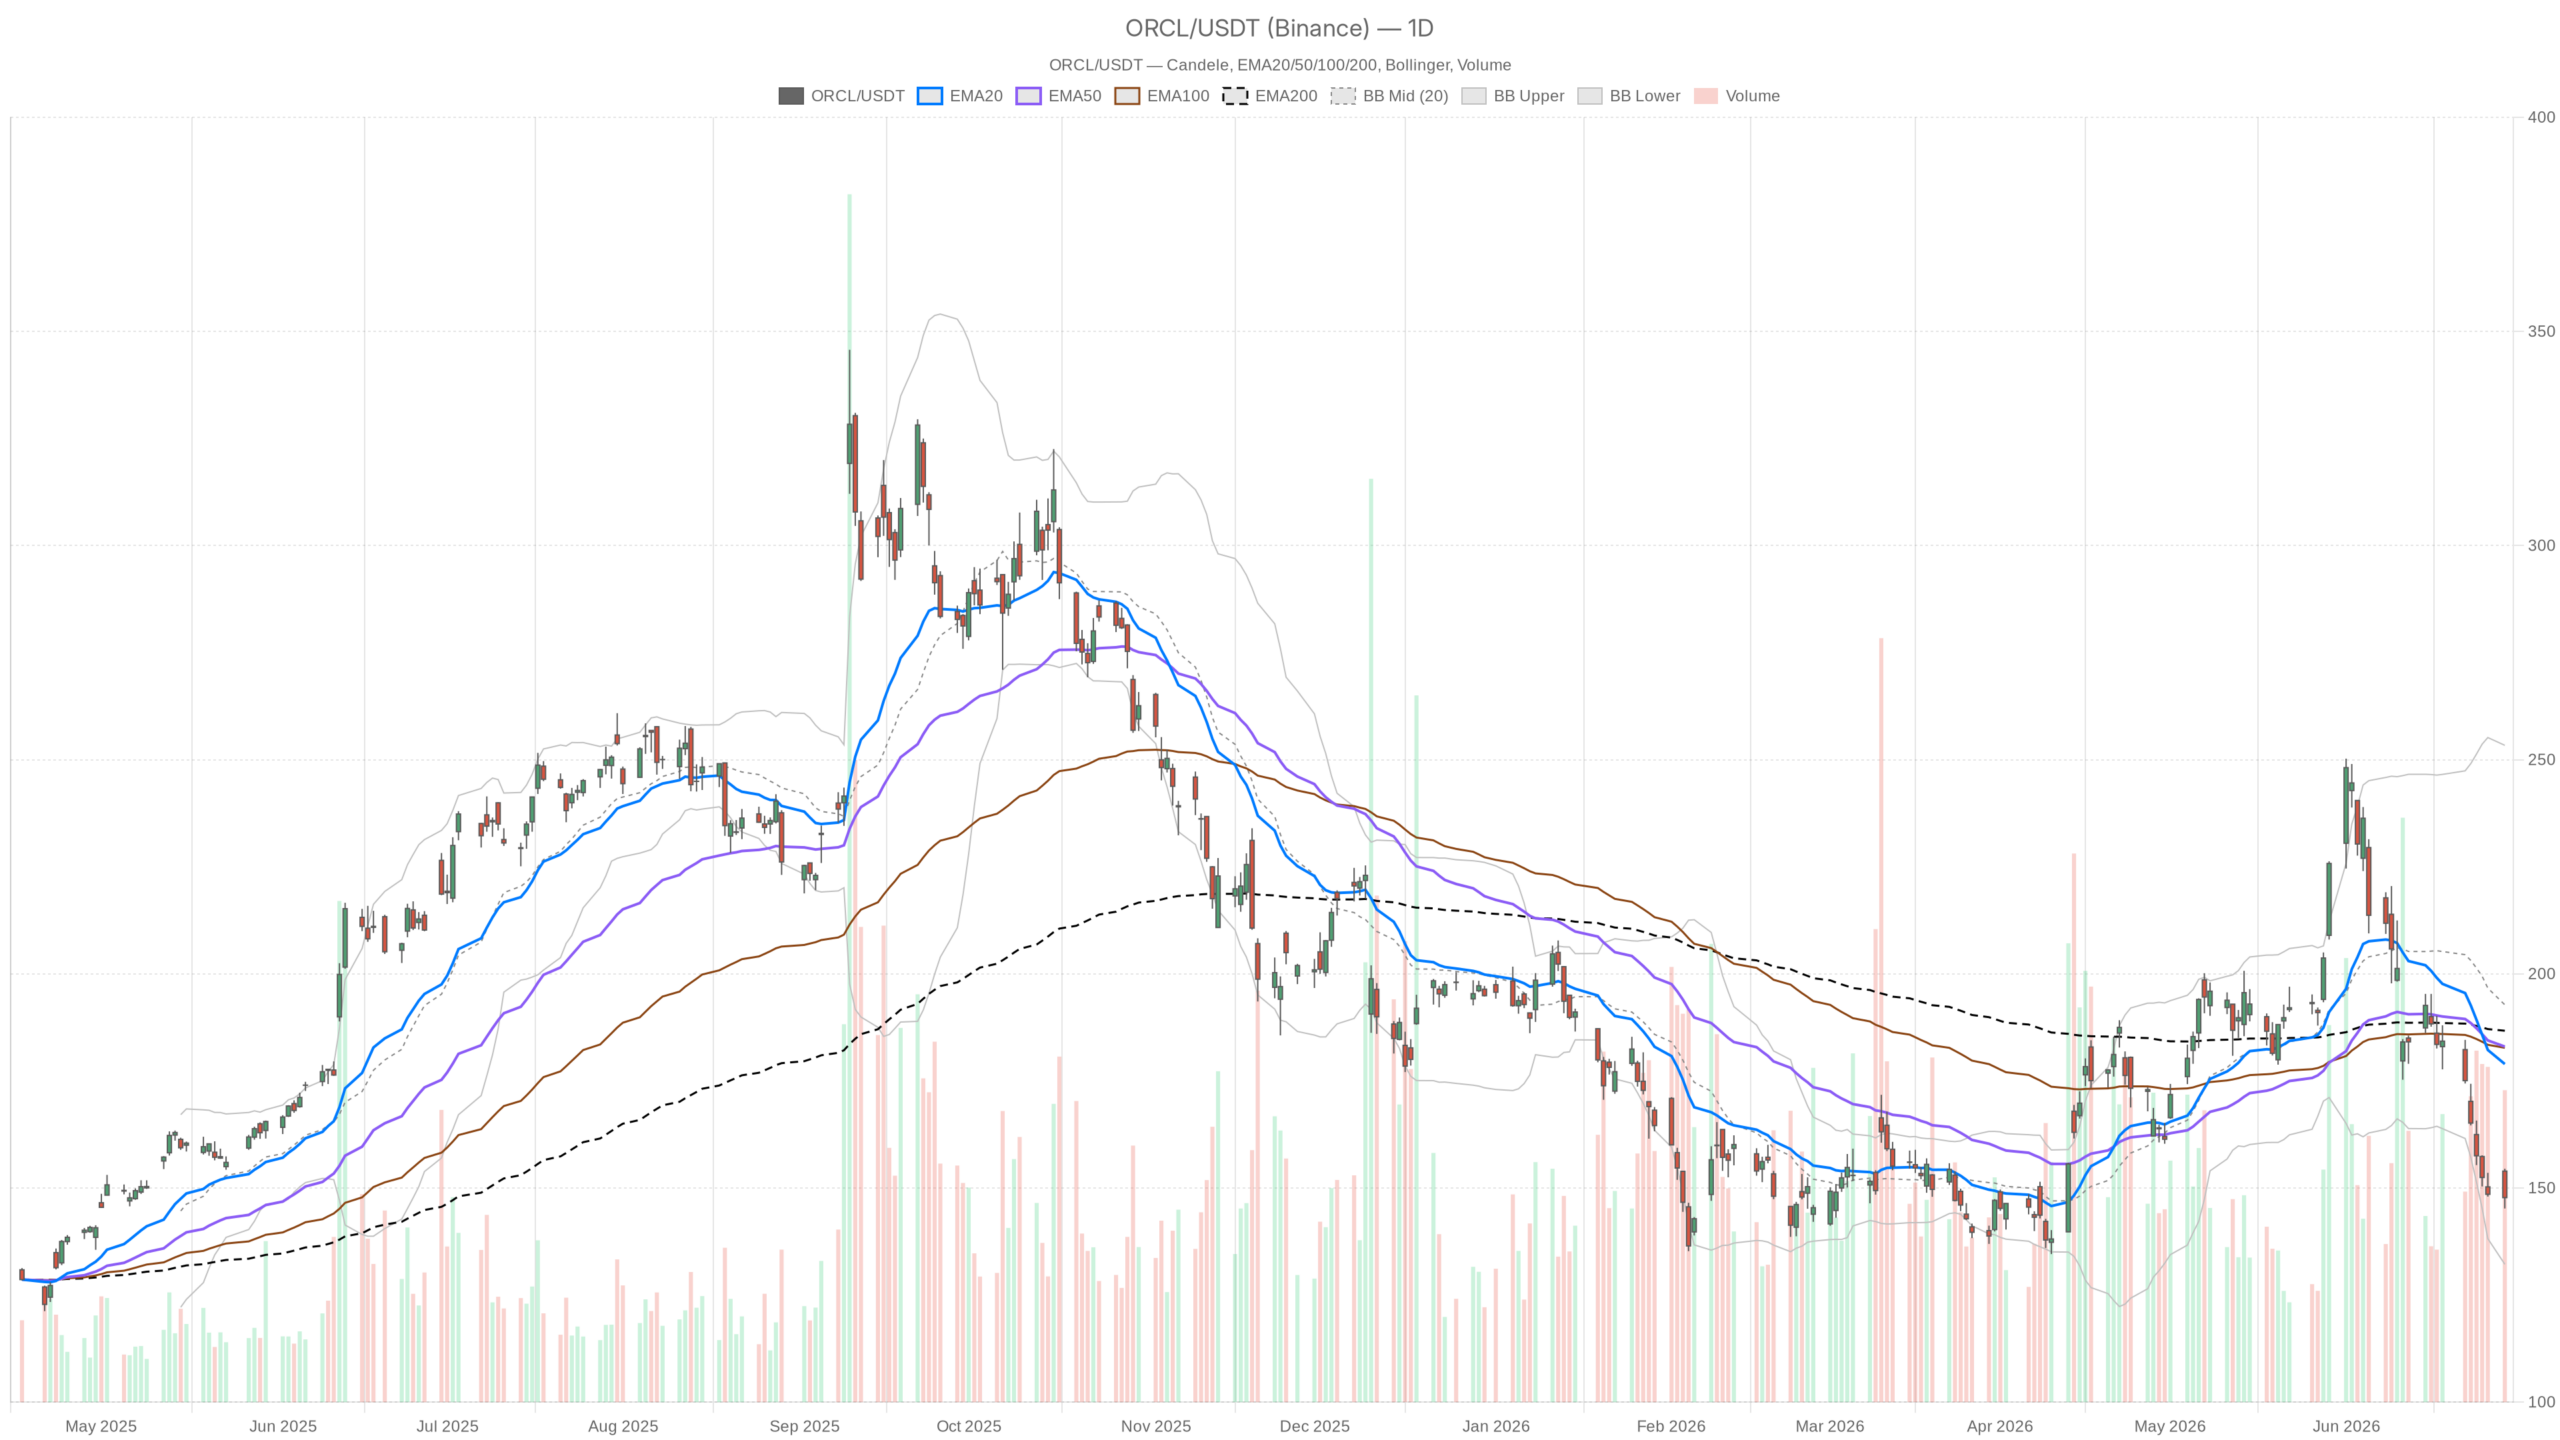 ORCL — daily chart with candlesticks, EMA20/EMA50 and volume.
Summary
Key takeaways
- Oracle stock dropped 19% in a single week — its worst weekly decline since the dot-com collapse of 2001.
- ORCL closed at $147.76, trading roughly $35–$39 below its 20-day, 50-day, and 200-day EMAs — all fully inverted.
- Daily MACD histogram at -6.47 confirms widening bearish momentum, while daily RSI at 29.34 sits deep in oversold territory.
- Hourly RSI at 22.35 signals extreme oversold conditions that could trigger a tactical bounce but not a structural reversal.
- A daily close below $143.82 (S1 support) would open a path toward the lower Bollinger Band near $132 with no natural floor between.
How Severe Is Oracle Stock’s Daily Chart Damage?
Oracle stock‘s daily chart shows a full structural breakdown. Price sits roughly $35–$39 below every major moving average, all of which are fully inverted — confirming an unambiguous bearish regime.
Moving Average Stack and MACD Confirm the Downtrend
ORCL’s EMA stack is entirely inverted. The 20-day EMA at $178.94, the 50-day at $183.02, and the 200-day at $186.72 all sit far above the current $147.76 price. A gap of that magnitude does not close quickly. It requires sustained accumulation and weeks of constructive price action. Neither is visible yet.
The daily MACD reinforces the bearish picture. The MACD line at -11.83 versus a signal at -5.36 produces a histogram of -6.47. The divergence is widening, not narrowing. This confirms that selling pressure remains the dominant force on the daily timeframe.
Oversold RSI, Bollinger Bands, and Volatility Context
Daily RSI at 29.34 hovers just above the 30 threshold — technically oversold territory. That reading alone is not a buy signal. Oversold conditions can persist throughout a strong downtrend. However, it does flag that selling has been severe enough to compress momentum to levels rarely sustained for long.
Meanwhile, the daily ATR of $11.39 signals a volatile and wide-ranging market. Moves in either direction carry real weight. Traders must respect that level of daily volatility when considering positioning. The Bollinger Band structure tells a similar story: the midband sits at $192.77, while the lower band is at $132.19. Current price at $147.76 is pressing toward the lower half of that range. There is statistical room to fall further before the lower band acts as a genuine mean-reversion anchor.
The pivot structure offers a nearer-term reference. Daily support sits at $143.82 (S1), with the pivot point itself at $149.16. Price hovers just below that pivot, which typically acts as short-term resistance on any bounce attempt.
Is Short-Term Oracle Stock Price Action Stabilizing?
Intraday charts suggest selling pressure is decelerating, but no reversal signal has materialized. The hourly MACD histogram has turned fractionally positive, while the 15-minute chart shows neutral consolidation within the broader downtrend.
Hourly Chart Shows Selling Deceleration, Not Exhaustion
On the 1-hour chart, the bearish regime persists. However, the hourly MACD histogram has turned fractionally positive at +0.73, even as the MACD line remains deeply negative at -4.09. This divergence between the line and the histogram suggests the pace of short-term selling may be decelerating. It is not a reversal signal. At best, it hints that intraday sellers are losing some momentum around the $147–$148 zone.
The hourly RSI at 22.35 is severely oversold — more so than the daily reading. This reinforces the idea that a technical snap-back could materialize without any fundamental catalyst. Still, the hourly EMA structure mirrors the daily: the 20-EMA at $151.33, the 50-EMA at $161.52, and the 200-EMA at $183.11 are all layered well above price. Each represents a potential resistance zone on any recovery attempt. The nearest ceiling is the 20-EMA near $151, which aligns closely with the upper hourly Bollinger Band at $153.72. Any bounce that fails to clear $151–$153 convincingly would simply confirm the bear trend remains intact.
15-Minute Chart: Neutral Consolidation Inside the Downtrend
Dropping to the 15-minute frame for execution context, the picture is slightly more balanced. RSI at 45.03 is neutral — no longer deeply oversold. The 15-minute MACD histogram is a slim positive at +0.05, essentially flat. Price is trading near its 20-EMA at $148.41, suggesting a brief stabilization within the larger downtrend.
In contrast to the wider daily ranges, the 15-minute Bollinger Bands are tight. The upper band sits at $149.41 and the lower at $147.27. Price oscillates inside that narrow band, indicating low immediate momentum in either direction. This is consolidation behavior, not accumulation.
How Do Fundamentals Weigh on Oracle Stock?
Oracle stock faces mounting scrutiny over its debt sustainability and the financial viability of its AI infrastructure spending ambitions. At the same time, Oracle did launch new AI-powered supply chain applications this week — a product development move that speaks to long-term positioning but does nothing for near-term sentiment in a tape that is already badly damaged.
Notably, Wedbush analyst Dan Ives labeled ORCL as “way oversold” alongside Microsoft, projecting a potential reversal over the next six to nine months. That framing is important. It is a medium-term thesis, not a near-term trade. A six-to-nine-month recovery window implies Ives sees the current level as a longer-term value entry, not a catalyst-driven bounce. This distinction matters for how one approaches timing.
Bull vs. Bear: Which Oracle Stock Scenario Prevails?
The bearish case carries more structural weight given the scale of technical damage. However, extreme oversold readings open the door to a tactical bounce scenario. The two paths diverge sharply from the $143.82 support level.
The bullish case rests on a combination of extreme oversold readings and stabilization above the $143.82 daily support. If ORCL can hold that floor and begin reclaiming the $149.16 pivot point on a closing basis, a technical recovery toward $153–$154 becomes plausible. The R1 pivot and the recent daily high sit in that zone. Meanwhile, a sustained push above the daily 20-EMA near $179 would be required to shift the structural bias. The AI supply chain product launches and analyst calls of oversold conditions provide a narrative backdrop for buyers willing to absorb near-term risk.
The bearish case is more straightforward. A daily close below $143.82 would breach S1 and open a path toward the lower Bollinger Band near $132. With the MACD histogram still deeply negative on the daily and no EMA support until well above current price, there are no natural technical floors between $143 and the lower band. Heavy debt concerns — should they escalate — could accelerate that move. Any broader market risk-off shift would compound the pressure.
Overall, Oracle stock remains in a confirmed downtrend across all three timeframes. The extreme oversold readings on both daily and hourly RSI suggest the severity of the decline is statistically unusual, and a technical bounce is possible at any moment. But a bounce and a trend reversal are very different things. With daily volatility running near $11 per session and price trading 25% below its 200-day moving average, this is a high-risk environment. Positioning here demands strict risk management, clear invalidation levels, and respect for the possibility that oversold conditions can persist far longer than intuition suggests.
FAQ
Is Oracle stock a buy after the 19% drop?
Not based on technicals alone. Oversold RSI readings and a potential tactical bounce do not equal a trend reversal. The structural downtrend remains intact until ORCL reclaims key moving averages, starting with the $149.16 pivot and the 20-EMA near $179.
What is Oracle stock’s key support level right now?
The nearest support floor is $143.82 (daily S1). Below that, the lower daily Bollinger Band near $132 becomes the next statistical anchor, with no natural technical floors in between.
How long could Oracle stock’s downtrend last?
Wedbush analyst Dan Ives projects a potential reversal over six to nine months. Without a structural catalyst, the downtrend could persist for weeks to months given the $35–$39 gap between price and its major moving averages.
What would signal a trend reversal in Oracle stock?
A sustained push above the daily 20-EMA near $179 would be the first structural signal. Before that, reclaiming the $149.16 pivot point and the $151–$153 zone would suggest short-term stabilization is underway.
{"@context":"https://schema.org","@type":"FAQPage","mainEntity":[{"@type":"Question","name":"Is Oracle stock a buy after the 19% drop?","acceptedAnswer":{"@type":"Answer","text":"Not based on technicals alone. Oversold RSI readings and a potential tactical bounce do not equal a trend reversal. The structural downtrend remains intact until ORCL reclaims key moving averages, starting with the $149.16 pivot and the 20-EMA near $179."}},{"@type":"Question","name":"What is Oracle stock's key support level right now?","acceptedAnswer":{"@type":"Answer","text":"The nearest support floor is $143.82 (daily S1). Below that, the lower daily Bollinger Band near $132 becomes the next statistical anchor, with no natural technical floors in between."}},{"@type":"Question","name":"How long could Oracle stock's downtrend last?","acceptedAnswer":{"@type":"Answer","text":"Wedbush analyst Dan Ives projects a potential reversal over six to nine months. Without a structural catalyst, the downtrend could persist for weeks to months given the $35–$39 gap between price and its major moving averages."}},{"@type":"Question","name":"What would signal a trend reversal in Oracle stock?","acceptedAnswer":{"@type":"Answer","text":"A sustained push above the daily 20-EMA near $179 would be the first structural signal. Before that, reclaiming the $149.16 pivot point and the $151–$153 zone would suggest short-term stabilization is underway."}}]}
Disclaimer: The content of this article solely reflects the author's opinion and does not represent the platform in any capacity. This article is not intended to serve as a reference for making investment decisions.
You may also like
Bitcoin Holds Near $59K as Israel Routes Defense Listings to Wall Street
NeoPulse consortium nears deal to acquire 40% of Wemade
Gold: Deeper pullback eyes October lows – Societe Generale
US JOLTS Job Openings expected to show strong labor demand, endorsing Fed rate hike bets