

Solana has started July with signs of stabilization after enduring weeks of sustained selling pressure. Although the recent rebound has improved short-term sentiment, the broader trend still favors caution.
Buyers have managed to defend critical support levels, yet the token continues to trade below several important moving averages. Consequently, the next few sessions could determine whether the current recovery develops into a stronger bullish reversal or fades into another downward move.
SOL currently trades near $74 after recovering from its recent swing low around $61. The rebound has pushed the price above the 20-day exponential moving average.
However, the token still struggles beneath the 50-day EMA near $75.20. Additionally, the price remains below the 100-day and 200-day EMAs, which continue to reinforce the broader bearish structure.
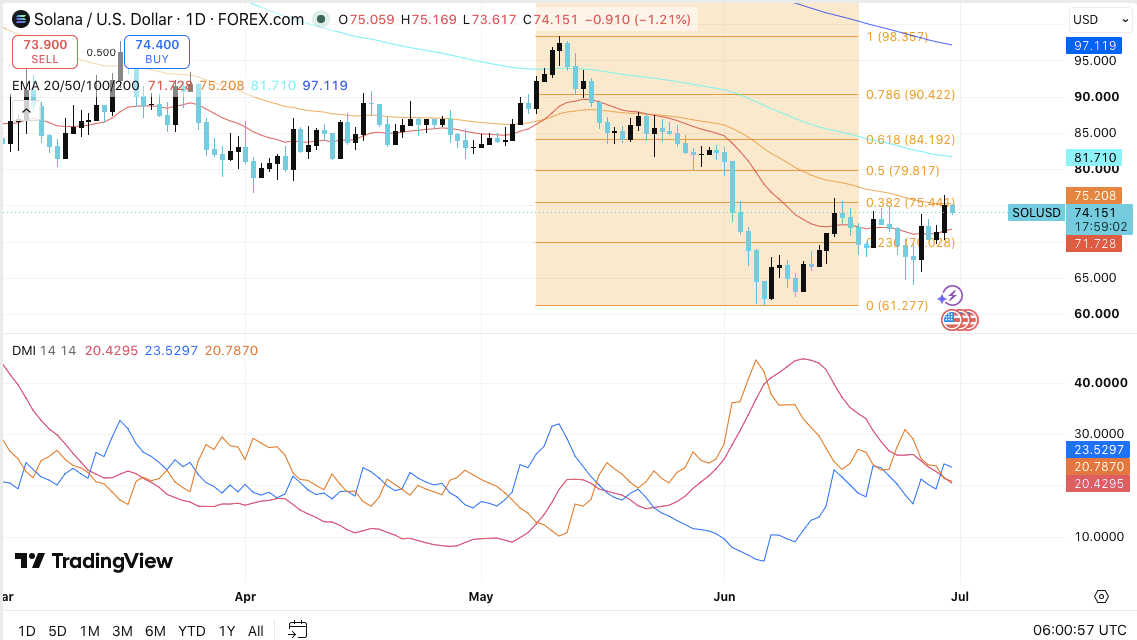
The immediate support zone sits between $71.70 and $72.00. Holding above this range could allow buyers to maintain the recent recovery.
However, losing that support may expose the next demand zone between $68 and $69. A deeper decline could eventually retest the June low near $61.28.
On the upside, the first challenge remains the $75.20 to $75.45 region. This area combines the 50-day EMA with the 38.2% Fibonacci retracement.
Related: Cardano Price Prediction July 2026: Is History About to Repeat for ADA This July?
A decisive break above that level could open the path toward $79.80. Moreover, clearing $84.20 would strengthen the bullish outlook and increase the possibility of a move toward $90.40.
Momentum indicators show gradual improvement, although conviction remains limited. The positive directional index has moved above the negative directional index, signaling growing buying strength. However, the Average Directional Index remains relatively low, suggesting the emerging trend lacks strong momentum.
 Source:
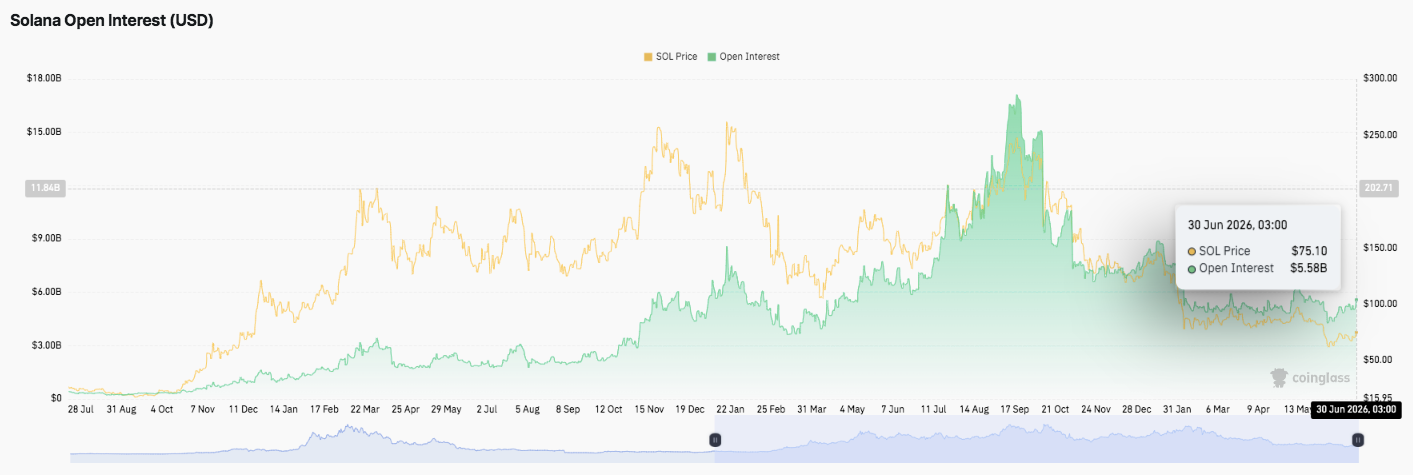
Open interest also reflects a cautious market environment. After peaking above $16 billion during September, outstanding futures positions steadily declined alongside the broader crypto correction.
Current open interest has stabilized around $5.58 billion, indicating leveraged speculation has cooled significantly. Consequently, traders appear willing to wait for stronger technical confirmation before increasing risk exposure.
 Source:
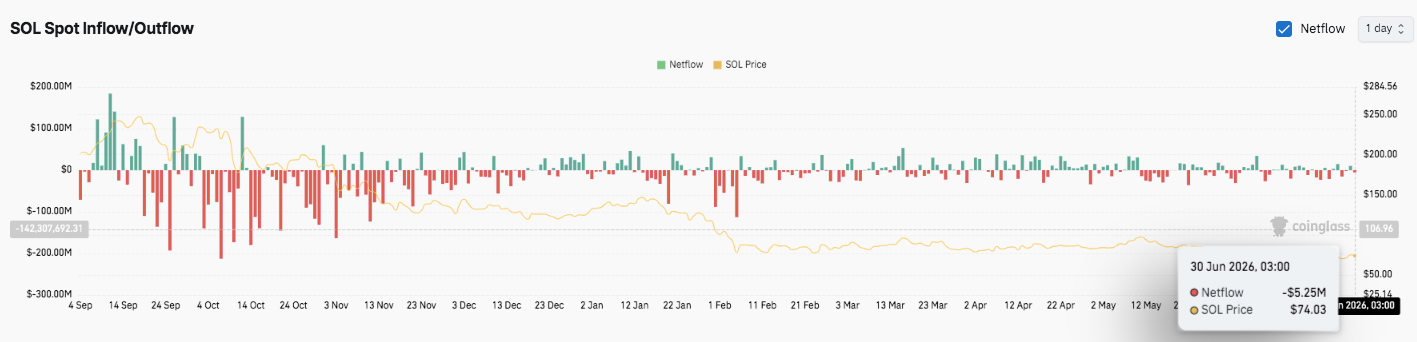
Spot exchange activity also presents a mixed picture. Earlier periods recorded several large net outflows exceeding $200 million, highlighting aggressive profit-taking during the decline. Although those extreme outflows have eased, sellers still maintain a modest advantage.
The latest data shows net outflows of roughly $5.25 million while SOL trades around $74. Besides, inflows have become more balanced in recent weeks, suggesting selling pressure has moderated.
Even so, sustained positive inflows would provide stronger evidence that investor confidence is returning. Until then, Solana’s recovery remains constructive but unconfirmed as July trading unfolds.
Key levels remain critical as Solana attempts to build on its recent recovery while trading below major long-term resistance.
Upside levels: $75.20–$75.45 marks the first resistance zone around the 50-day EMA. A successful breakout could target $79.80, followed by $84.20 and $90.40 if bullish momentum accelerates.
Downside levels: $71.70–$72.00 serves as immediate support near the 20-day EMA. Below that, $68.00–$69.00 becomes the next demand zone, while $61.28 remains the key swing low that bulls must defend.
Resistance ceiling: The 100-day EMA near $81.70 represents the major barrier to restoring medium-term bullish momentum. Reclaiming this level would significantly improve the technical outlook.
The broader technical picture shows Solana recovering within an established bearish trend. Momentum indicators have improved, but trend strength remains modest as buyers seek confirmation above key moving averages. Meanwhile, stable open interest and easing spot outflows suggest selling pressure has moderated, although fresh capital has yet to return aggressively.
Solana’s July outlook depends on whether buyers can secure a decisive close above the $75.20–$75.45 resistance zone. Such a move would strengthen the case for an advance toward $79.80 and potentially $84.20. If market participation improves alongside rising open interest and sustained spot inflows, SOL could extend its recovery toward $90.40.
However, failure to hold support between $71.70 and $72.00 would likely shift momentum back to sellers, exposing $68.00–$69.00 and possibly the $61.28 swing low. For now, Solana remains at a technical crossroads, with price action, derivatives activity, and capital flows expected to determine the next major move.