

- Solana processed 100M daily transactions as weekly non-vote activity crossed 1B, signaling sustained network demand.
- Tokenized asset activity accelerated, with RWA transfer volume reaching $8.57B over 30 days.
- Solana dApps generated $262M in Q2 revenue, maintaining leadership across major blockchain ecosystems.
Solana ecosystem metrics continue improving as transaction activity, application revenue, and tokenized asset trading expand. Network usage remains elevated while price action shows a constructive recovery.
Network Activity Remains Elevated
Tanaka recently argued Solana looks stronger than its token chart suggests. The supporting dashboards show substantial economic activity across multiple categories.
 Source:
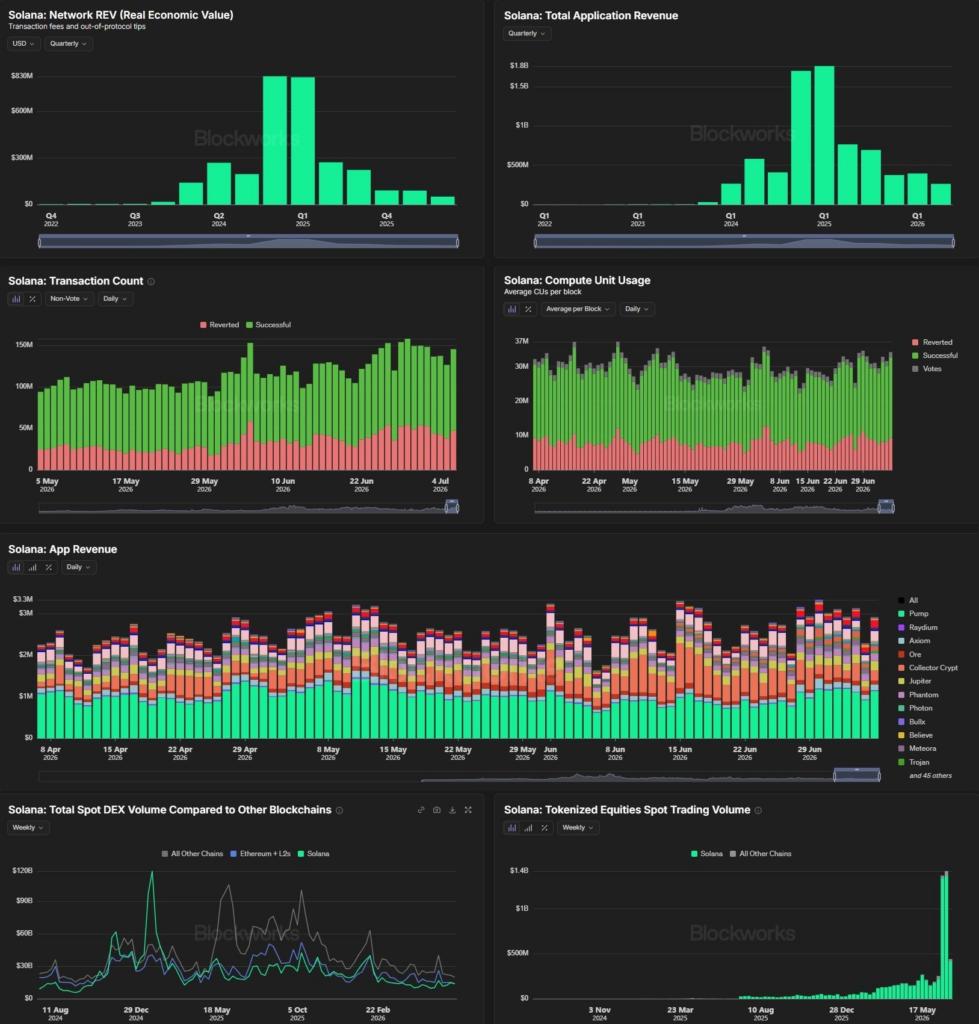
Daily transaction counts remain near 100 million, according to the charts. Successful transactions continue dominating overall network activity.
Early July also marked the first week exceeding one billion non-vote transactions. That milestone points to growing demand beyond validator-related operations.
Daily active addresses reached approximately 1.93 million during the quarter. DEX volume averaged about $2.09 billion per day.
Revenue And Real-World Asset Growth
The revenue from quarterly applications boasted a substantial rise by late 2024 and early 2025. Although activity later moderated, revenue remained historically elevated.
Solana dApps generated roughly $262 million during Q2, according to Tanaka. That represented about 41% of all Web3 dApp revenue.
Pump.fun remained the largest revenue contributor during the quarter. Jupiter, Raydium, Phantom, Meteora, and other applications also contributed meaningfully.
Tokenized asset activity accelerated across the ecosystem. Thirty-day RWA transfer volume reached approximately $8.57 billion.
Price Structure Turns Constructive
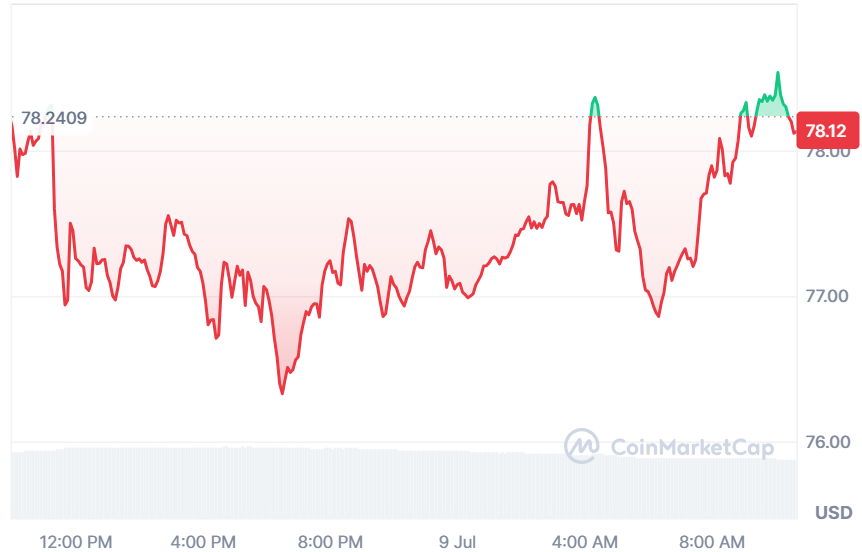
The intraday chart shows Solana recovering after early-session weakness. Buyers gradually regained control following a sharp drop toward lower support.
 Source:
SOL later reclaimed the psychological $78 area during the recovery. The advance developed through a series of higher lows.
Support now sits around the $77.00-$77.20 zone after repeated defenses. Holding that area preserves the current recovery structure.
Support is seen at $78.18-$78.32 levels, where previous rallies have failed to find traction. If the breakout occurs above that zone, it will be better for the short-term technical picture.


