

 thecryptobasic.com
Solana has flashed a new bullish technical signal after its SuperTrend indicator flipped to a “buy.”
The signal suggests the broader trend may have shifted in favor of buyers. However, the rally still faces a major test. $SOL must break through a key resistance zone before it can target higher levels around $100 and $127.
At press time, Solana is trading at $78, down 5.54% over the past week but still up an impressive 20% on the monthly chart.
SuperTrend Flips Bullish Above $78
Notably, the bullish signal appeared after Solana broke above $78 on June 30. That move triggered a buy signal from the SuperTrend indicator on the three-day chart, and Solana subsequently posted a 16% gain, reaching $83.98.
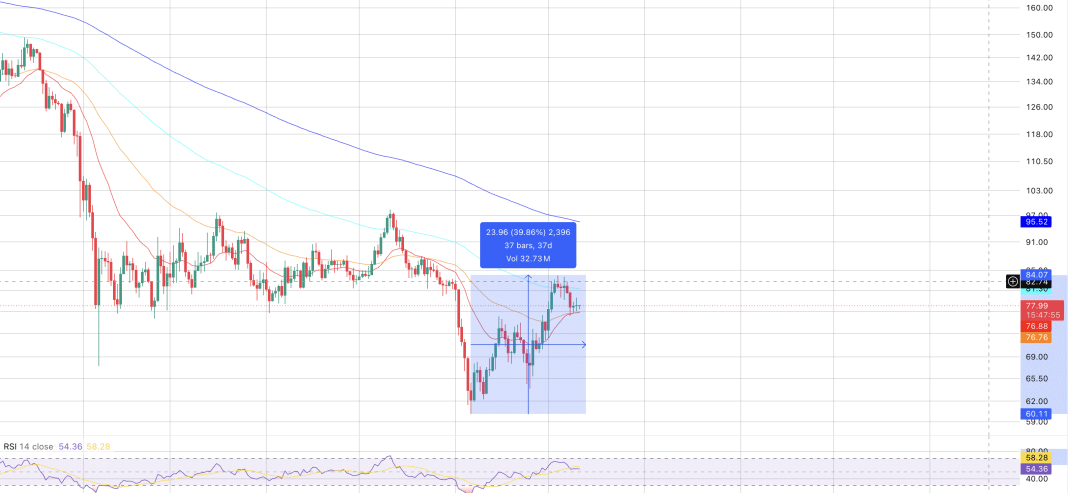 Solana Chart TradingView
It is the first bullish flip since October 2025 and marks the end of a prolonged bearish trend. The previous SuperTrend sell signal came before a 74% decline in $SOL’s price, making this reversal one that traders are watching closely.
The indicator now points to a broader bullish trend. If buying momentum continues, $SOL could climb toward $100.
Solana Exchange Outflows and Network Growth Add Support
On-chain data also supports the improving technical picture. Between June 24 and July 3, investors withdrew about 1.5 million $SOL, worth roughly $120 million, from cryptocurrency exchanges.
The outflows suggest investors are moving tokens into self-custody instead of leaving them on exchanges for sale. That could reduce near-term selling pressure.
Meanwhile, Solana added around 1.6 million new addresses over the past three weeks. The increase points to growing network activity and steady user participation.
Together, the exchange outflows, rising address count, and bullish SuperTrend signal suggest market conditions are improving.
$79–$85 Remains the Key Resistance Zone
Despite the stronger outlook, the $79–$85 range remains the biggest hurdle for bulls. According to UTXO Realized Price Distribution (URPD) data, around 105 million $SOL changed hands within this range. That has created a dense supply zone where many holders may choose to sell once they break even.
A decisive move above $85 could clear this overhead resistance. It would also open the door to the next major target around $100, followed by $127.
If $SOL fails to reclaim this zone, selling pressure could return as investors look to exit their positions.
A Drop Below $74 Would Weaken the Bullish Outlook
Downside risks remain. If $SOL falls below $74, the SuperTrend indicator could flip back to a sell signal, invalidating the current bullish setup.
In that scenario, the chances of a deeper correction would increase. URPD data shows the next major support level sits near $53 if sellers regain control.


