
A chart overview of commodity support and resistance: Gold, Silver, Oil, Gas + Platinum, Palladium, Copper, Agricultural Futures (July 16, 2026)

Huitong Finance, July 16 — A single chart shows the support and resistance for commodities: gold, silver, oil, gas + platinum, palladium, copper + agricultural futures, updated at 07:40 on Thursday, July 16, 2026 (UTC+8). It specifically covers 14 varieties including gold, silver, platinum, palladium, copper + crude oil, natural gas, gasoline + wheat, corn, cotton. For more details, refer to the custom charts in Huitong Finance Analysis.
A single chart shows the support and resistance for commodities: gold, silver, oil, gas + platinum, palladium, copper + agricultural futures, updated at 07:40 on Thursday, July 16, 2026 (UTC+8). It specifically covers 14 varieties including gold, silver, platinum, palladium, copper + crude oil, natural gas, gasoline + wheat, corn, cotton. For more details, refer to the content of Huitong Finance Analysis’s custom chart.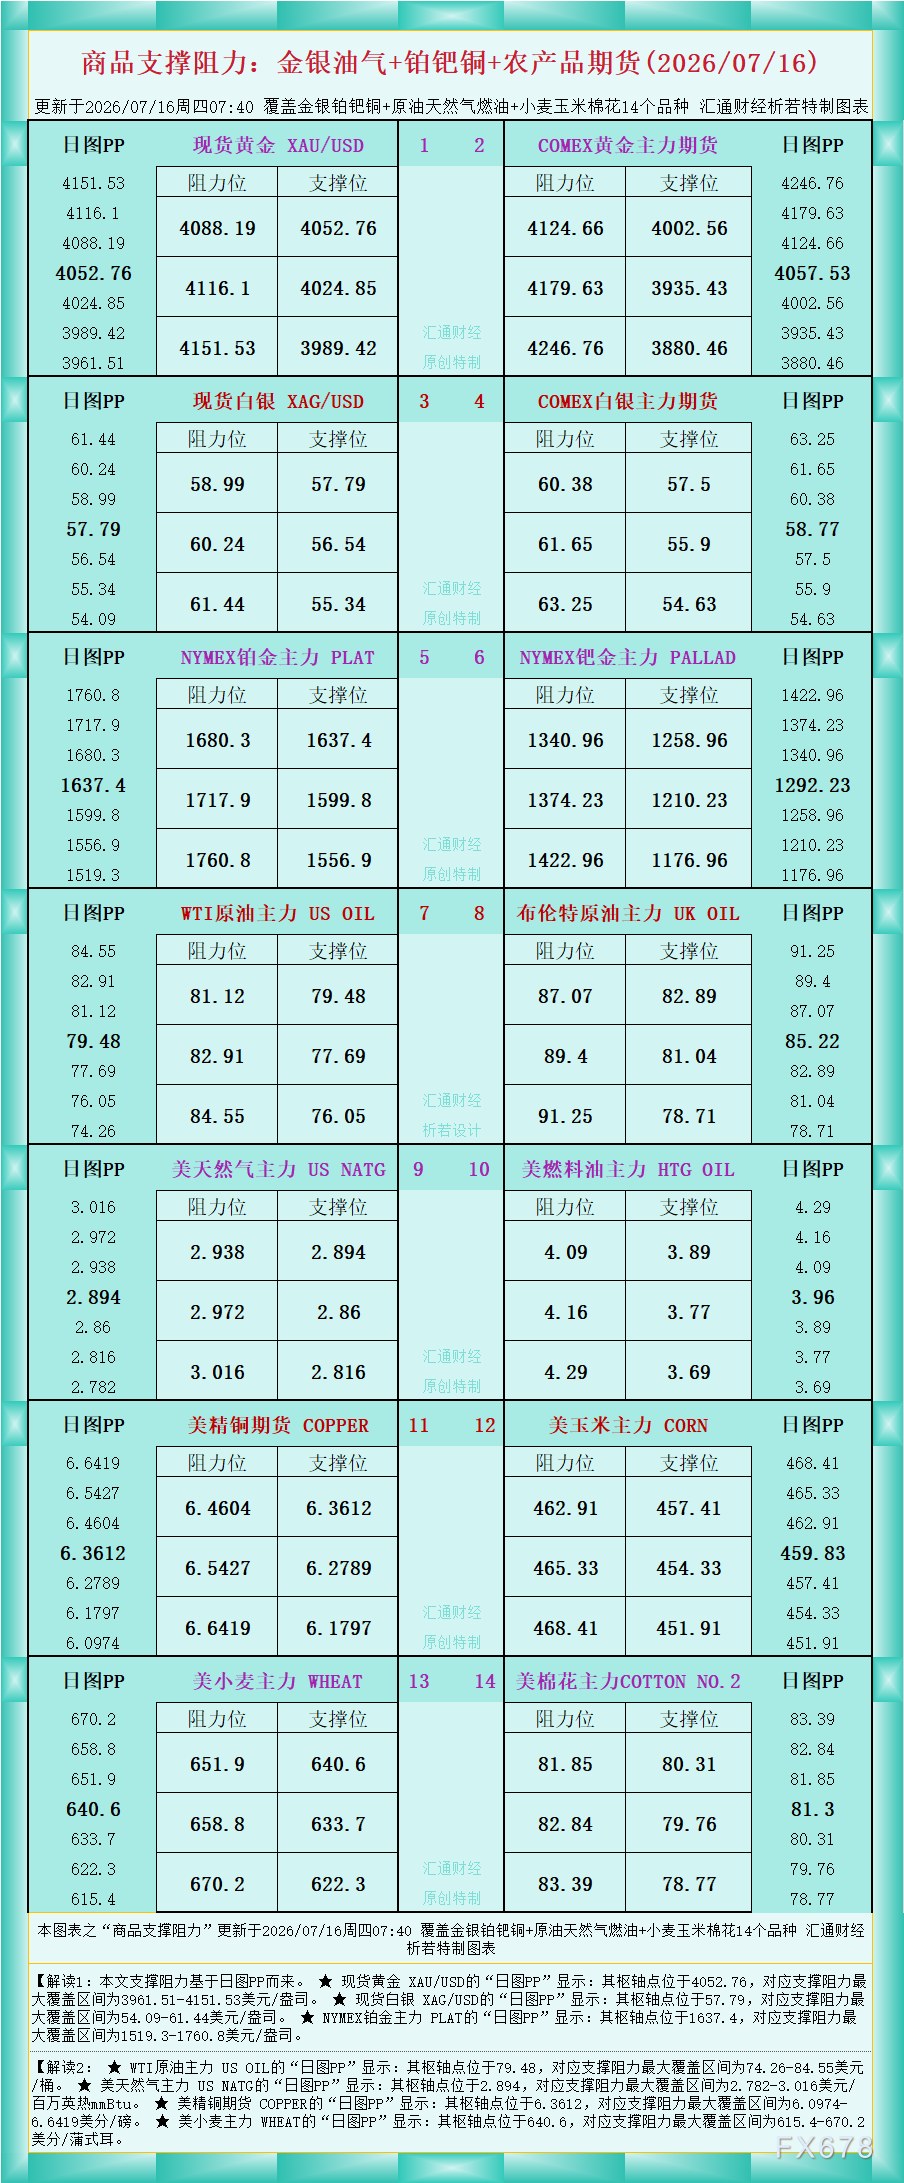
As shown in the chart data, Interpretation 1: The support and resistance in this article are based on Daily PP.
★ For spot gold XAU/USD, the “Daily PP” shows: the pivot is at 4052.76, with maximum support and resistance zone at 3961.51-4151.53 USD/oz.
★ For spot silver XAG/USD, the “Daily PP” shows: the pivot is at 57.79, with maximum support and resistance range at 54.09-61.44 USD/oz.
★ For NYMEX platinum main contract PLAT, the “Daily PP” shows: the pivot is at 1637.4, with maximum support and resistance zone at 1519.3-1760.8 USD/oz.
Interpretation 2:
★ For WTI crude oil main contract US OIL, the “Daily PP” shows: the pivot is at 79.48, with maximum support and resistance zone at 74.26-84.55 USD/barrel.
★ For US natural gas main contract US NATG, the “Daily PP” shows: the pivot is at 2.894, with maximum support and resistance zone at 2.782-3.016 USD/MMBtu.
★ For US copper futures COPPER, the “Daily PP” shows: the pivot is at 6.3612, with maximum support and resistance zone at 6.0974-6.6419 cents/lb.
★ For US wheat main contract WHEAT, the “Daily PP” shows: the pivot is at 640.6, with maximum support and resistance zone at 615.4-670.2 cents/bushel.
For more interpretations of varieties, please refer to the chart. Original and custom-made by Huitong Finance. All rights reserved. For reference only.
Disclaimer: The content of this article solely reflects the author's opinion and does not represent the platform in any capacity. This article is not intended to serve as a reference for making investment decisions.
You may also like
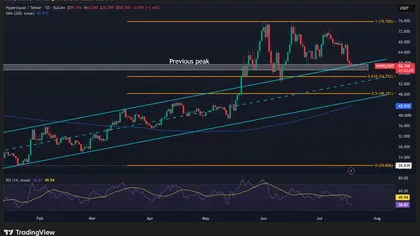
Will Hyperliquid’s 3x revenue drop keep HYPE’s price below $60?
Data Center Costs Soar! Another Oracle Crash?
Oracle's $16.5 billion AI data center project in New Mexico has been forced to change its planned self-built natural gas power plant to fuel cells due to environmental approval obstacles, resulting in additional costs of several billion dollars. Meanwhile, the Wisconsin project has incurred over $100 million in extra expenditures due to regulatory rulings related to shared power transmission costs and credit ratings. Recently, S&P downgraded Oracle's rating, highlighting the generally hidden costs faced by tech giants in AI infrastructure construction, including environmental protection, water resources, and community permits.
TRON trades at $0.3253 as Tron Inc. boosts treasury holdings, targets $0.3518
XRP Issuer Ripple Relaunches CLARITY Act Push Backed by 200+ Groups
Crypto prices
More


