
AST SpaceMobile, Inc. Stock Drops 13% After $1B Convertible Notes Offering

AST SpaceMobile, Inc. stock is under severe pressure after a $1 billion convertible notes offering triggered a 13% after-hours drop. Shares closed at $66.31 on July 15. Deteriorating daily indicators had already signaled weakness before the catalyst amplified the selloff.
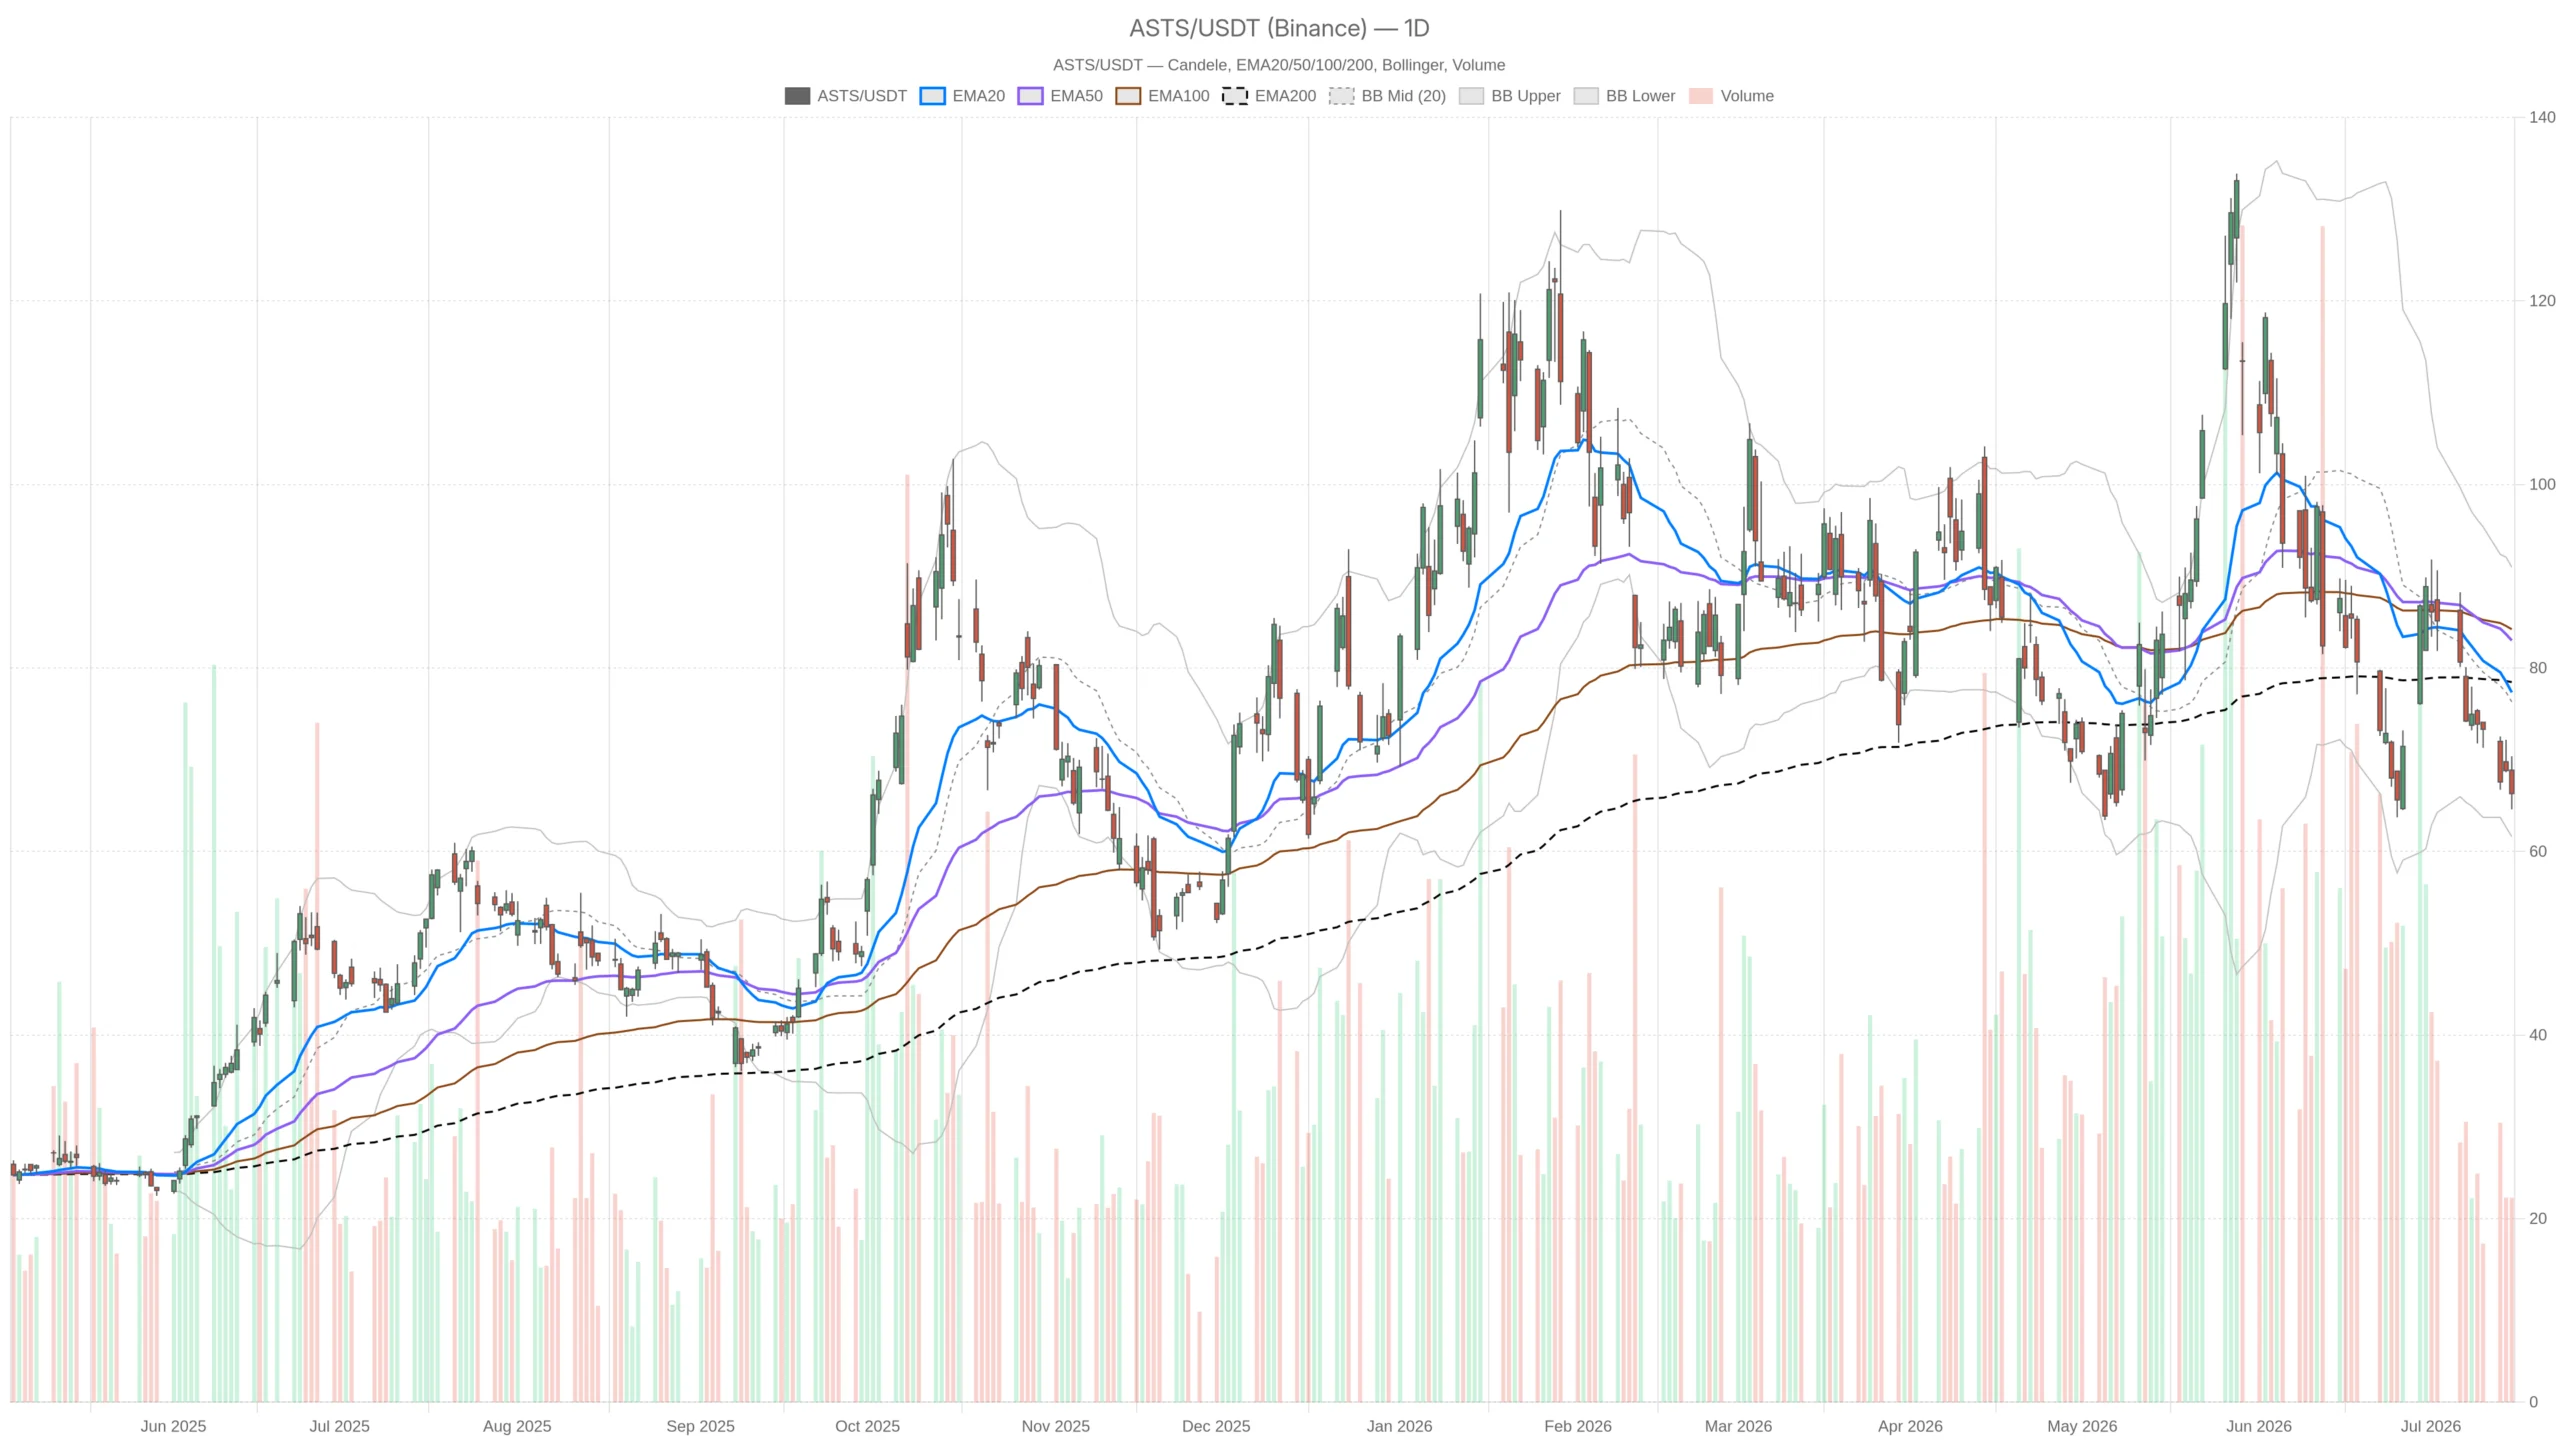 ASTS — daily chart with candlesticks, EMA20/EMA50 and volume.
Summary
- Key takeaways
- Daily Bias: Bearish Pressure Dominates AST SpaceMobile, Inc. Stock
- Hourly Structure Confirms the Weakness
- 15-Minute Context: No Clean Entry, No Clear Floor
- The Catalyst: $1 Billion in Convertible Notes and What It Signals
- Bullish Scenario: What Would Need to Change
- Bearish Scenario: The Path of Least Resistance
- Positioning and Uncertainty
- FAQ
Key takeaways
- ASTS closed at $66.31 on July 15, below its EMA20 ($77.34), EMA50 ($83.00), and EMA200 ($78.46).
- A $1 billion convertible senior notes offering due February 1, 2034, triggered a 13% after-hours decline.
- Daily RSI sits at 38.25 with MACD deepening to -5.21, confirming accelerating downside momentum.
- Immediate support sits at $63.81 (daily pivot S1), with the lower Bollinger Band at $61.62.
- Bearish regime is confirmed across daily and hourly timeframes, with no reversal signal in sight.
Daily Bias: Bearish Pressure Dominates AST SpaceMobile, Inc. Stock
AST SpaceMobile, Inc. stock is firmly entrenched in a bearish regime on the daily chart. Price closed at $66.31 on July 15, sitting below every major moving average. That stacking structure reflects sustained distribution across the market.
Moving Average Structure Signals Distribution
The EMA20 at $77.34, EMA50 at $83.00, and EMA200 at $78.46 all tower above the current price. Short-term averages sit below long-term ones, with price beneath all three. This alignment confirms that sellers remain in control on the daily timeframe.
Momentum Indicators Deepen the Bearish Case
The daily RSI at 38.25 confirms persistent weakness. It approaches oversold territory but has not yet reached levels that typically trigger mean-reversion buying. More importantly, the reading reflects momentum still pointed lower. Meanwhile, the MACD line at -5.21 has deepened further below the signal line at -4.27. The histogram at -0.93 shows the trend accelerating rather than decelerating.
Volatility Context and Pivot Levels
Bollinger Bands place the midline at $76.30, with the upper band at $90.99 and the lower band at $61.62. Price currently hugs the lower half of this range. The daily ATR of $6.95 underscores the extreme volatility each session can deliver. Daily pivot analysis places the pivot point at $67.09, with resistance at $69.60 and support at $63.81. The close at $66.31 fell below the pivot, signaling a technically weak session. The next meaningful floor sits at $63.81.
Hourly Structure Confirms the Weakness
ASTS mirrors its daily weakness on the hourly chart. The timeframe is explicitly tagged bearish, with price trailing below all moving averages in a descending sequence.
Moving Average and RSI Alignment
Price closed the last hourly session at $66.22. It trails below the EMA20 at $68.37, EMA50 at $71.70, and EMA200 at $79.90. The averages themselves trend downward in bearish order. The hourly RSI at 36.55 echoes the daily reading almost precisely. It shows no recovery impulse whatsoever.
MACD Nuance and Key Levels
However, the hourly MACD offers a marginal exception. The line at -1.72 versus the signal at -1.75 produces a slightly positive histogram of 0.03. This is micro-stabilization at best — not a trend reversal. The Bollinger Band midline sits at $67.96, with price below it. The ATR at $1.75 confirms meaningful intraday swings. Pivot analysis places resistance tightly at $66.70 and support at $65.97. With price already below the hourly pivot at $66.46, the near-term bearish bias remains intact.
15-Minute Context: No Clean Entry, No Clear Floor
AST SpaceMobile, Inc. stock offers no clean entry signal on the 15-minute chart. The timeframe is tagged bearish, with price below both the EMA20 and EMA50.
Price closed at $66.22 on this frame, trading below the EMA20 at $66.79 and EMA50 at $67.70. However, the MACD histogram prints a mild positive reading of 0.09. This suggests the very short-term selling impulse may be temporarily exhausting.
Still, the 15-minute RSI at 41.49 is not deeply oversold. Any interpretation of a near-term bounce remains tentative. The ATR at $0.61 indicates tight intraday volatility on this frame. Yet the broader context from the daily and hourly charts means any bounce will likely find sellers quickly. Resistance near the pivot at $66.46 and R1 at $66.70 stands ready to cap rallies.
The Catalyst: $1 Billion in Convertible Notes and What It Signals
AST SpaceMobile, Inc. stock fell 13% after hours following the announcement of a $1 billion convertible senior notes offering. The market’s reaction was swift and unequivocally negative.
Dilution Fears Drive the Selloff
The offering involves convertible senior notes due February 1, 2034. It was priced at a 20% premium, with capped calls added to limit dilution impact. Nevertheless, the scale of the raise overwhelmed those mitigants. A $1 billion convertible note offering represents meaningful potential dilution of existing shareholders. The proceeds target growth initiatives including satellite launches and potential M&A activity.
Strategic Logic Versus Market Skepticism
One analyst cited possible acquisition targets including ULA, Firefly, Relativity Space, and Stoke Space. This suggests the capital raise may be tied to a move into the rocket launch segment. On one hand, the strategic logic is coherent. A space-based cellular broadband network needs launch infrastructure. Securing that capability could reduce long-term costs. On the other hand, markets are clearly unwilling to reward ambition without clarity. The absence of a definitive target and the size of the raise have spooked investors. Notably, the stock had already been declining steadily before the announcement.
Bullish Scenario: What Would Need to Change
ASTS has a credible bullish case, but it requires specific conditions to materialize. A technical floor and fundamental catalysts must align for any sustainable recovery.
The daily lower Bollinger Band at $61.62 represents the most obvious technical floor. A strong bounce from that zone would be the first signal worth monitoring. It would need to be combined with a bullish RSI divergence and a flattening MACD histogram.
Beyond technicals, the bullish thesis requires fundamental support. Confirmation of a specific, well-received acquisition target could reframe the capital raise. One that meaningfully accelerates satellite deployment cadence would shift the narrative from dilutive to strategically necessary. Additionally, positive news around commercial partnerships or government contracts would help rebuild confidence. A reclaim of the daily pivot at $67.09, followed by a sustained move above $69.60, would be the first technical sign that sellers are losing control.
Bearish Scenario: The Path of Least Resistance
The stock currently faces a bearish case far better supported by the evidence. Technical deterioration and fundamental uncertainty combine into a formidable headwind.
Price sits below all daily moving averages. The MACD continues declining. RSI hovers near oversold without reversal signals. Meanwhile, the fresh dilution catalyst amplifies every technical weakness. The after-hours drop of 13% — if carried into the next regular session — would push ASTS toward the $57–$58 range. That level sits well below the daily Bollinger lower band at $61.62.
In that scenario, the lower band loses its meaning as short-term support. The stock would enter uncharted territory relative to recent price structure. Continued uncertainty around the use of proceeds would likely sustain selling pressure. Speculation around M&A targets without confirmation only adds to the headwind. A failure to reclaim the daily pivot at $67.09 in coming sessions would further entrench the bearish regime. Momentum sellers would likely increase their positions.
Positioning and Uncertainty
AST SpaceMobile, Inc. stock navigates a difficult combination of deteriorating technicals and a disruptive fundamental event. Patience is the most defensible posture right now.
The daily timeframe defines a clear downtrend. The hourly chart confirms it. The 15-minute frame offers no meaningful reversal signal. The $1 billion convertible note offering may prove strategically sound over time. However, the market’s immediate judgment is harsh and unambiguous.
With a daily ATR of nearly $7 and an after-hours move of 13%, volatility is elevated and unpredictable. Any positioning at this stage must account for wide price swings. There is no established support below $63.81. This is not an environment for impulsive decisions. The levels that would signal either stabilization or capitulation must guide every trading decision.
FAQ
Why did AST SpaceMobile, Inc. stock drop after hours on July 15?
The stock fell 13% after the company announced a $1 billion private offering of convertible senior notes due February 1, 2034. Despite a 20% pricing premium and capped calls to limit dilution, investors reacted negatively to the potential share dilution and uncertainty around the use of proceeds.
What are the key support levels for ASTS stock?
The immediate support sits at $63.81, which is the daily pivot S1 level. Below that, the daily lower Bollinger Band at $61.62 represents the next technical floor. If selling pressure persists, the after-hours trajectory points toward the $57–$58 range.
Is AST SpaceMobile, Inc. stock oversold?
Not yet. The daily RSI at 38.25 is approaching oversold territory but has not reached extreme levels that typically trigger mean-reversion buying. Momentum indicators continue to point lower without clear reversal signals.
What would signal a recovery in ASTS stock?
A credible recovery would require a strong bounce from the $61.62 support zone, combined with a bullish RSI divergence and a flattening MACD histogram. A reclaim of the daily pivot at $67.09 followed by a sustained move above $69.60 would be the first technical confirmation that selling pressure is easing.
{"@context":"https://schema.org","@type":"FAQPage","mainEntity":[{"@type":"Question","name":"Why did AST SpaceMobile, Inc. stock drop after hours on July 15?","acceptedAnswer":{"@type":"Answer","text":"The stock fell 13% after the company announced a $1 billion private offering of convertible senior notes due February 1, 2034. Despite a 20% pricing premium and capped calls to limit dilution, investors reacted negatively to the potential share dilution and uncertainty around the use of proceeds."}},{"@type":"Question","name":"What are the key support levels for ASTS stock?","acceptedAnswer":{"@type":"Answer","text":"The immediate support sits at $63.81, which is the daily pivot S1 level. Below that, the daily lower Bollinger Band at $61.62 represents the next technical floor. If selling pressure persists, the after-hours trajectory points toward the $57–$58 range."}},{"@type":"Question","name":"Is AST SpaceMobile, Inc. stock oversold?","acceptedAnswer":{"@type":"Answer","text":"Not yet. The daily RSI at 38.25 is approaching oversold territory but has not reached extreme levels that typically trigger mean-reversion buying. Momentum indicators continue to point lower without clear reversal signals."}},{"@type":"Question","name":"What would signal a recovery in ASTS stock?","acceptedAnswer":{"@type":"Answer","text":"A credible recovery would require a strong bounce from the $61.62 support zone, combined with a bullish RSI divergence and a flattening MACD histogram. A reclaim of the daily pivot at $67.09 followed by a sustained move above $69.60 would be the first technical confirmation that selling pressure is easing."}}]}
Disclaimer: The content of this article solely reflects the author's opinion and does not represent the platform in any capacity. This article is not intended to serve as a reference for making investment decisions.
You may also like
Gold Price Forecast: XAU/USD stays below 20-day EMA, sees further downside below $3,940
Tether invests $20M in Argentine neobank Ualá’s $197M funding round
Ostium’s $18M exploit raises a bigger question: Is ‘instant settlement’ worth the risk?
Crypto prices
More


