

XRP is trading close to $1.09 after spending much of the week within a confined price range, with market participants focused on a potential breakout above key resistance levels. Current technical conditions show that while the $1.15–$1.20 region is coming into focus, the token remains below several major barriers, and a clear trend direction has yet to emerge.
XRP eyes $1.20 as inverse head-and-shoulders pattern forms, price hovers near $1.09
By:Cointurk
Bitget offers one-stop trading for cryptocurrencies, stocks, and gold. Trade now!
A welcome pack worth 6200 USDT for new users! Sign up now!
XRP tests key demand zone
On the 4-hour XRP/USD chart, the price faced recent rejection from the $1.12–$1.13 resistance zone and declined toward the $1.06 demand area, which overlaps with the lower edge of an ongoing consolidation structure. Analysts note that this area is a crucial inflection point for short-term momentum.
A sustained position above $1.06 could allow buyers to retake $1.10 and, potentially, $1.12. Conversely, a break below this zone would weaken the bullish outlook and increase the likelihood of continued downside movement.
XRP traded above $2 earlier in 2026 but has since stabilized at lower levels amid fading momentum. CoinDesk data shows that end-of-June network activity and inflows had yet to produce the kind of decisive recovery buyers are seeking. The $1.10 level remains a key area of focus, as XRP struggles to convert resistance into support.
XRP’s position above the $1.06 demand zone is critical for preserving its ongoing recovery structure. A drop below this level could undermine the short-term bullish setup, while a hold above it would enable a renewed push toward resistance levels at $1.10 and $1.12.
Level Type Status
| $1.06 | Support (Demand Zone) | Testing |
| $1.10–$1.12 | Neckline/Resistance | Not broken |
| $1.15–$1.20 | Next Resistance | Potential target |
Inverse head-and-shoulders and wedge formation
A potential inverse head-and-shoulders pattern has appeared on the daily chart, with the “head” forming near $1.05–$1.07 and the “shoulders” at slightly higher lows. The neckline falls around the $1.10–$1.12 area, matching the zone that traders are monitoring for confirmation of sustained upward movement.
An inverse head-and-shoulders is typically viewed as a possible bullish reversal pattern, but confirmation requires a definitive price close above the neckline region. The same chart depicts XRP within a falling wedge—a bullish setup if a breakout is sustained beyond $1.10–$1.12—that, alongside the head-and-shoulders, signals possible technical confluence but does not guarantee a rally.
If neckline resistance is broken, subsequent resistance levels appear at $1.15 and then $1.18–$1.20, where sellers have previously capped upward moves. A move above $1.20 would be seen as a stronger bullish development in the current context.
Analysts and crypto news sources reported XRP’s difficulty maintaining momentum above $1.14–$1.15. If the token overcomes this range, the next zone of interest could extend toward $1.17–$1.20.
Technical analysis consistently highlights $1.10–$1.12 as the neckline for a potential bullish reversal in XRP, while $1.15–$1.20 stand out as the immediate resistance cluster to break for upward confirmation.
Mini dictionary: Inverse head-and-shoulders, a classic technical analysis reversal pattern characterized by three troughs, where the middle is the lowest (the “head”) and the outer two are higher (“shoulders”). It suggests a possible shift from a downtrend to an uptrend, but requires confirmation through a break above the neckline.
XRP price prediction and resistance outlook
Analysts see the $1.20–$1.35 region as a key test if XRP can clear resistance at $1.12 and $1.15. A move above these areas could open the way for higher targets, including $1.25–$1.35 if breakout momentum is sustained, and potentially as high as $1.45–$1.55 in the event of a more pronounced expansion.
For now, the ability to flip the $1.10–$1.12 region into support will determine if the bullish reversal pattern gains traction. Without this development, the reversal setup remains incomplete.
XRP/BTC SuperTrend and broader signals
The XRP/BTC ratio offers a longer-term perspective. ChartNerdTA, a crypto market observer, points out that the pair’s monthly SuperTrend indicator turned bullish in 2024 after several years of declining performance. This shift coincided with a relative rise in XRP compared to BTC, peaking in July 2025.
Currently, the ratio is once again near a crucial test zone on this indicator. If XRP holds above that area, it could signal renewed strength against Bitcoin; a breakdown would point toward continued underperformance.
Mini dictionary: SuperTrend, a technical indicator that identifies price trend direction using volatility and price action, helping traders spot potential shifts in market momentum.
This distinction is important since XRP’s performance relative to the US dollar does not always mirror its position within the broader crypto market. The XRP/BTC ratio thus serves as an additional context for interpreting price strength or weakness.
XRP price outlook
The immediate focus for XRP is the narrow technical range between $1.05–$1.07 as support and $1.10–$1.12 as the critical neckline level. Sustaining above support can keep recovery hopes alive, while resistance at $1.15 and the $1.18–$1.20 cluster will define the next steps for any bullish advance.
For now, XRP remains in consolidation, with technical signals indicating the need for further confirmation before any clear trend direction develops. Traders are closely watching whether XRP can break out decisively above $1.10–$1.12 and hold $1.15 as support to validate its latest reversal attempt.
0
0
Disclaimer: The content of this article solely reflects the author's opinion and does not represent the platform in any capacity. This article is not intended to serve as a reference for making investment decisions.
Understand the market, then trade.
Bitget offers one-stop trading for cryptocurrencies, stocks, and gold.
Trade now!
You may also like
Pudgy Penguins: Why PENGU’s retail push isn’t winning over bears yet
AMBCrypto•2026/07/20 10:03
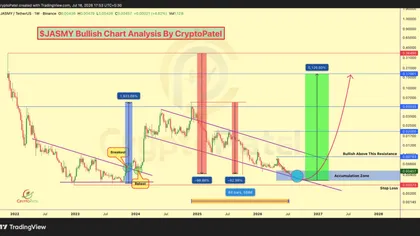
JASMY Price Prediction After Crypto Patel Signals 40x Setup
CoinCryptoNewz•2026/07/20 10:03
Capital B announces 10-for-1 reverse stock split effective September 8
Cryptobriefing•2026/07/20 10:03
$PUMP Momentum Builds: Ansem Buying + Power of 3 Structure Signals 56% Move Ahead
Coinsprobe•2026/07/20 10:03
Crypto prices
More
Bitcoin
BTC
$64,146.7
-0.54%

Ethereum
ETH
$1,862.77
-0.14%

Tether USDt
USDT
$0.9990
-0.03%

USDC
USDC
$0.9998
-0.00%

XRP
XRP
$1.09
-0.51%

Solana
SOL
$76.36
+0.52%

TRON
TRX
$0.3259
-0.24%

Hyperliquid
HYPE
$60.74
-0.55%

Dogecoin
DOGE
$0.07197
-0.66%

Zcash
ZEC
$530.85
-5.17%
How to buy BTC
Bitget lists BTC – Buy or sell BTC quickly on Bitget!
Trade now
Become a trader now?A welcome pack worth 6200 USDT for new users!
Sign up now