
Meta Stock Added $270B in July. Can the Rally Survive This Pullback?

Meta stock trades at $646.01, caught between a strong daily uptrend and mounting intraday selling pressure. July’s 21% surge added $270 billion in market cap. Yet the latest session’s 3.1% drop raises a pressing question: can the rally survive this pullback?
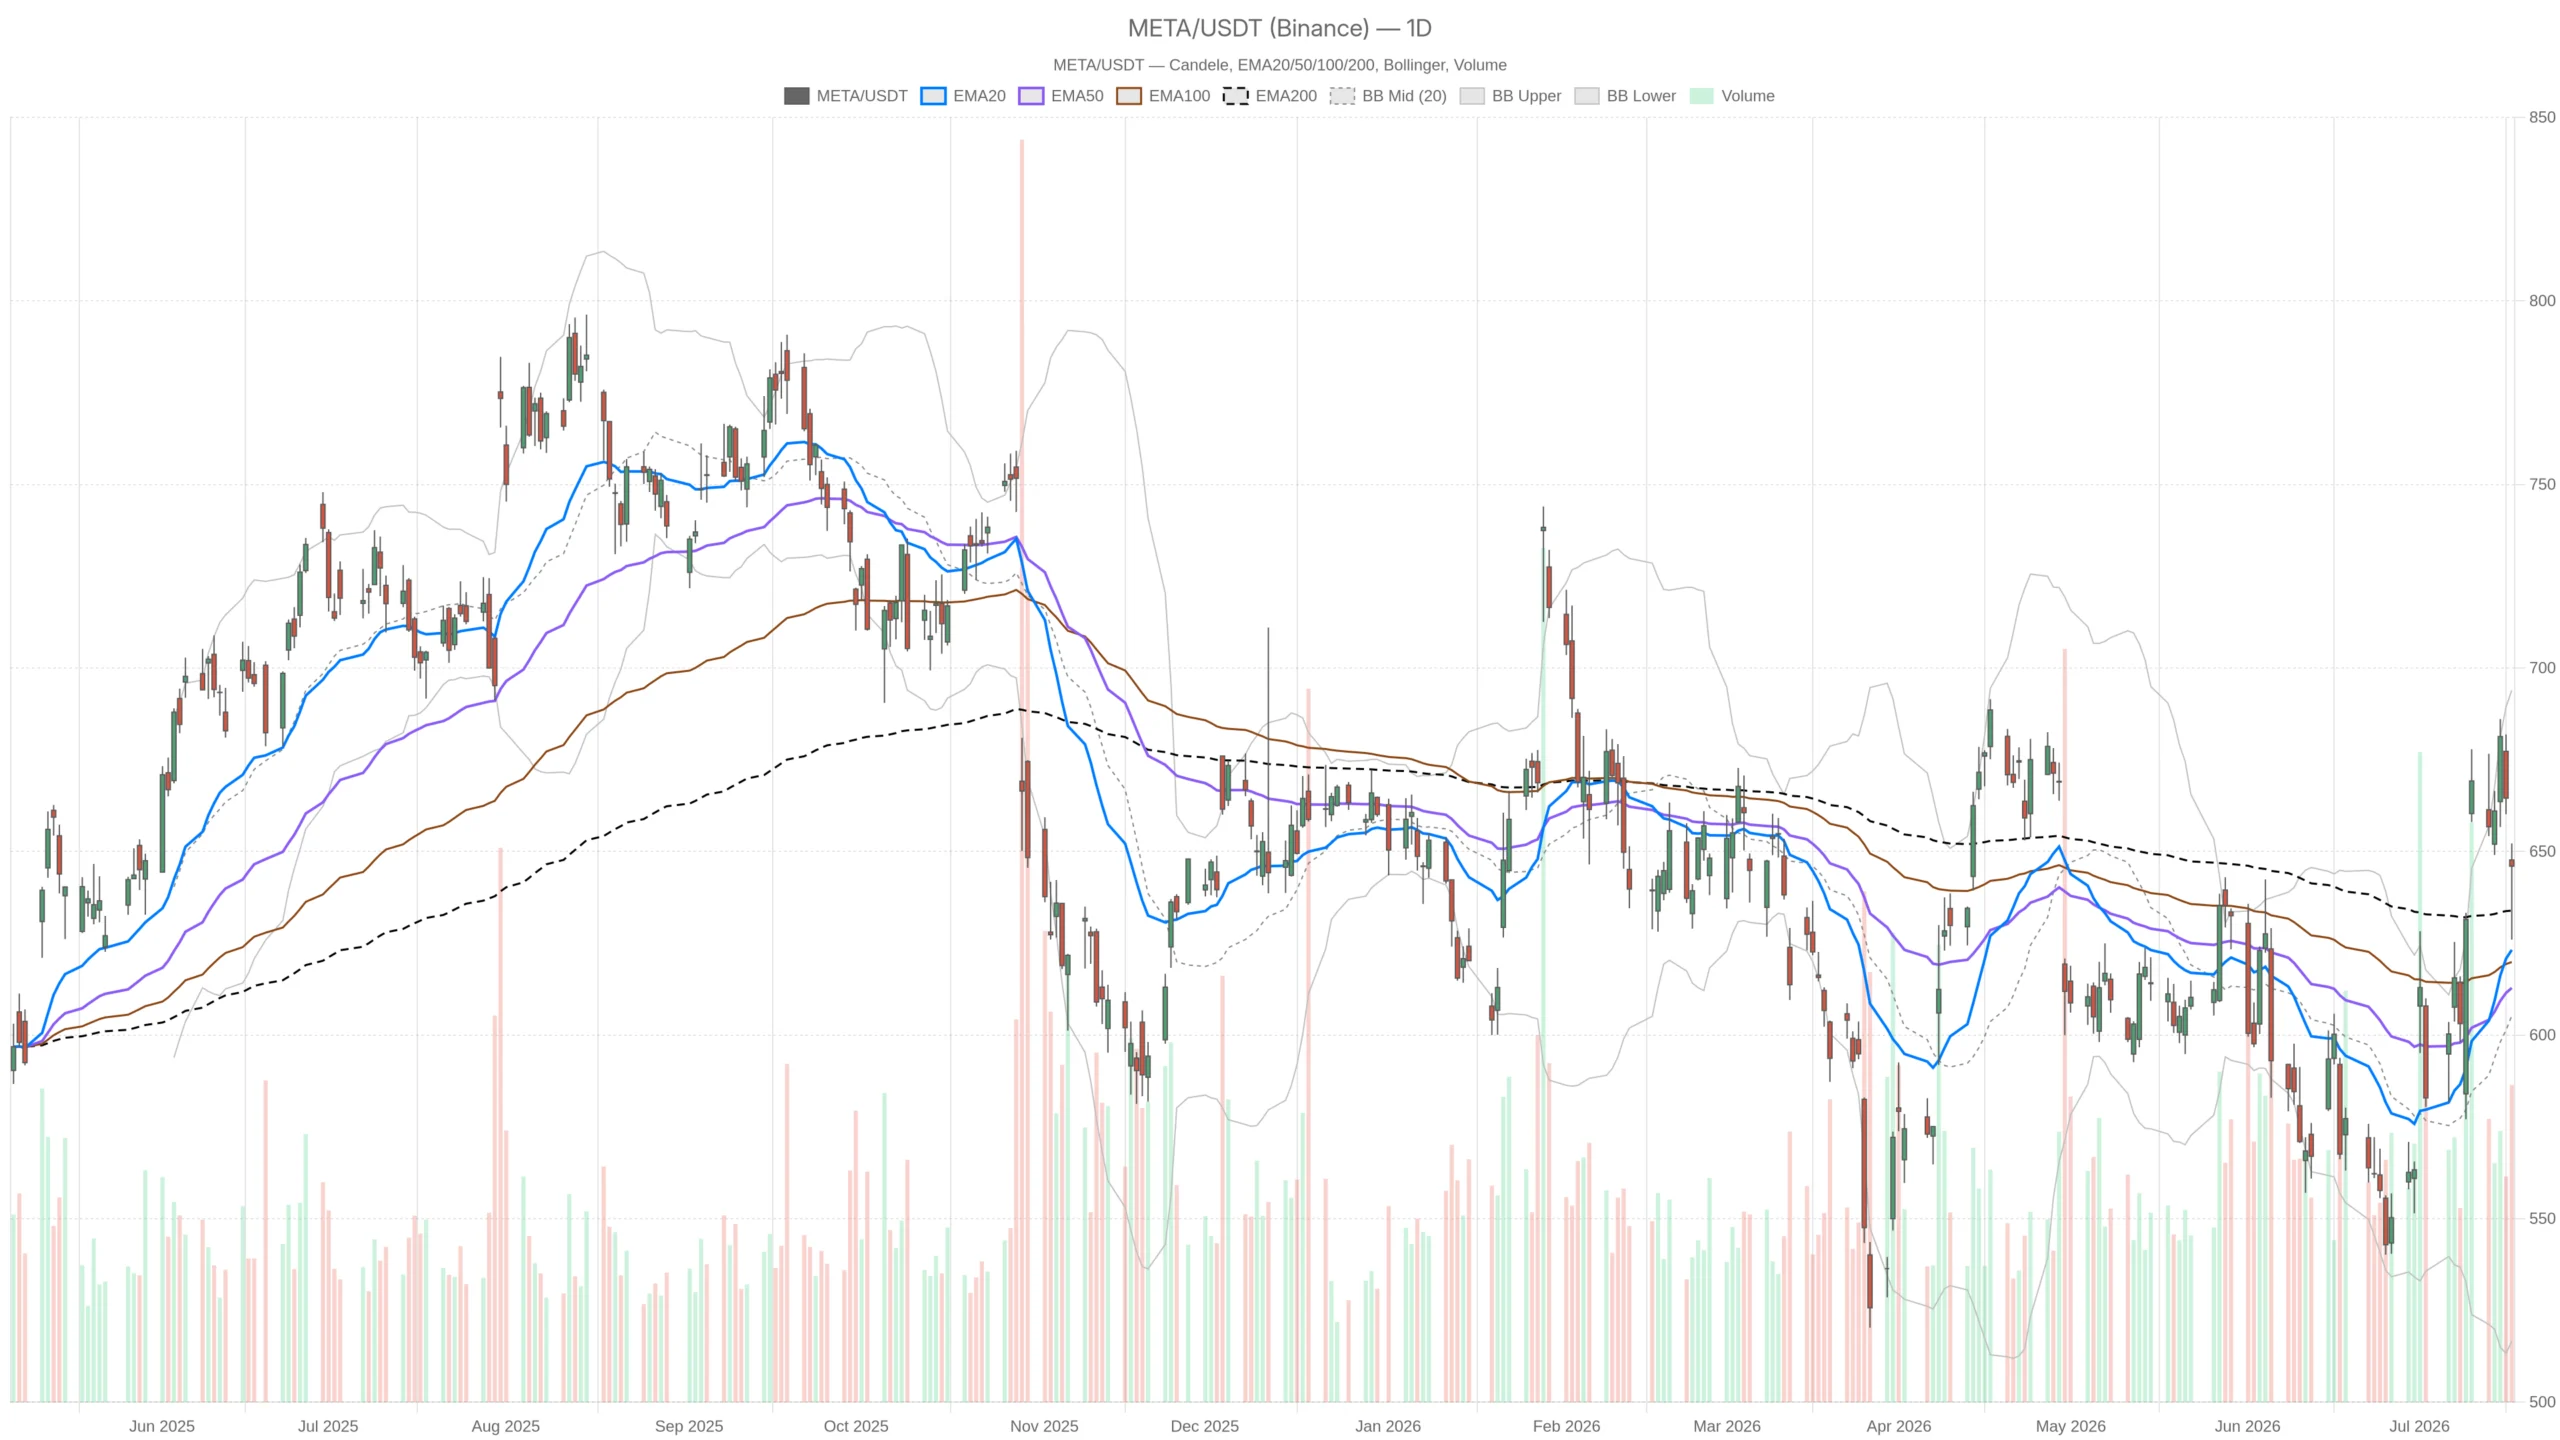 META — daily chart with candlesticks, EMA20/EMA50 and volume.
Summary
- Key takeaways
- Meta Stock Holds Ground After a Volatile Month
- Daily Timeframe: Constructive Bias, But Not Bulletproof
- Intraday Signals Complicate the Picture
- 15-Minute Frame: Early Signs of Stabilization
- The Bullish Scenario: AI Infrastructure and Technical Support
- The Bearish Scenario: AI Spending Anxiety and Intraday Pressure
- Positioning in a High-Volatility Environment
- FAQ
Key takeaways
- Meta stock closed at $646.01 on July 17, up 21% in July, adding $270 billion in market capitalization.
- The daily trend remains bullish with price above the EMA20 ($623.20), EMA50 ($612.83), and EMA200 ($633.89).
- The 1-hour chart shows bearish pressure with price below both the EMA20 ($655.36) and EMA50 ($649.00).
- The session’s 3.1% intraday decline was tied to AI spending concerns and broader tech selling.
- Meta’s in-house Iris AI chip enters production in September, supporting a plan to double computing capacity to 14 gigawatts.
Meta Stock Holds Ground After a Volatile Month
Meta stock maintains a constructive daily posture above key moving averages, despite short-term selling that trimmed the latest session by 3.1%. The stock trades at $646.01 as of July 17, navigating a complex technical landscape. A broadly constructive daily structure runs into clear short-term deterioration.
The stock has surged 21% in July alone, adding $270 billion in market capitalization. That rally was driven by AI momentum and what analysts call a cheap valuation relative to Magnificent Seven peers. Yet the most recent session’s 3.1% intraday decline reminds traders that the move is not frictionless.
The central question is whether the daily uptrend has enough structural support to survive the current pullback. Intraday weakness may be a leading signal of something more serious — or simply noise within a still-valid trend.
Daily Timeframe: Constructive Bias, But Not Bulletproof
The daily chart for Meta stock presents a net positive setup. Price sits above all three major moving averages. Meanwhile, momentum indicators remain firmly in bullish territory.
Moving Average Stack and Momentum Confirm the Trend
Meta closed at $646.01, sitting comfortably above the EMA20 at $623.20 and the EMA50 at $612.83. This stacking of short- and medium-term moving averages below price confirms the uptrend remains intact. Notably, the stock also cleared the EMA200 at $633.89. That level had long acted as a gravitational ceiling. Reclaiming it signals a shift from recovery mode to trend-continuation mode. The daily RSI at 56.8 sits in comfortable bullish territory without being overbought. There is room for further upside before the indicator reaches exhaustion levels near 70. Meanwhile, the MACD confirms the constructive picture. The line at 19.26 is well above the signal at 11.02, with a histogram of 8.24 still expanding. Daily momentum remains firmly in the bulls’ favor.
Volatility Bands and Pivot Levels Frame the Risk
Bollinger Bands on the daily frame are notably wide. The upper band sits at $693.92, while the lower rests at $516.59. This reflects the elevated historical volatility generated by July’s surge. Price sits near the midpoint at $605.25, suggesting the band structure does not yet read as stretched. The ATR14 at $30.66 quantifies the environment precisely. Intraday swings of $30 or more are the norm, not the exception. Traders should size positions accordingly. Meanwhile, the daily pivot point sits at $641.40, with R1 resistance at $656.81 and S1 support at $630.61. The close at $646.01 is above the pivot — a mild positive signal. However, the session’s intraday range from $626 to $652.20 captured both support and resistance zones. This reflects genuine indecision despite the bullish close.
Intraday Signals Complicate the Picture
On the 1-hour chart, Meta stock presents a meaningfully different picture. Price trades below key intraday moving averages, and momentum has turned negative.
Notably, the tone shifts on this timeframe. Price at $646.02 trades below both the EMA20 at $655.36 and the EMA50 at $649.00. That is a bearish short-term configuration. Price sits under its intraday moving averages, not above them. The H1 MACD reinforces this bearish tilt. The line at -4.06 sits below the signal at -0.78, with the histogram at -3.28. Hourly momentum is clearly negative.
The H1 RSI at 43.48 drifts toward oversold territory but has not reached it. That leaves room for further short-term weakness before a technical bounce becomes probable. In contrast to the daily, where momentum is building, the hourly frame is in active deceleration. This conflict across timeframes deserves respect.
The H1 Bollinger midline sits at $662.81 — well above current price. Price trading beneath the midband typically signals that the path of least resistance is sideways-to-lower. The 1-hour ATR at $11.31 remains elevated. Therefore, short-term moves of that magnitude can materialize quickly in either direction.
15-Minute Frame: Early Signs of Stabilization
The 15-minute chart for Meta stock offers tentative hints of a short-term floor forming. However, confirmation remains elusive.
On the 15-minute chart, the MACD histogram has flipped slightly positive at 0.89. Yet the MACD line remains negative at -1.94. That divergence suggests selling momentum may be decelerating at the micro level. The 15m RSI at 48.55 is neutral — neither oversold nor overbought. This is consistent with a market catching its breath.
Price closed just above the 15m EMA20 at $645.57, adding a small constructive note. However, the EMA50 and EMA200 on this frame both sit above current price, at $651.96 and $649.36 respectively. The execution context here favors patience. A push through the $649–$652 zone would be the first sign that intraday sellers are losing control.
The Bullish Scenario: AI Infrastructure and Technical Support
The bullish case for Meta stock rests on an intact daily trend and a compelling fundamental narrative centered on AI infrastructure spending.
Technically, the daily trend remains intact. The EMA stack is bullish, and momentum indicators have not rolled over. A recovery above the $656 R1 pivot level would signal that buyers have absorbed the recent selling. Meanwhile, the fundamental side offers additional support.
Meta’s in-house Iris AI chip enters production in September. This is part of a plan to double computing capacity to 14 gigawatts. Some analysts argue Wall Street underestimates the long-term growth implications of that infrastructure buildout. At the same time, Meta is cited alongside Nvidia and Microsoft as one of the three biggest bargain stocks among the Magnificent Seven. The stock is described as trading at cheap valuations relative to its growth profile. A higher yield and faster growth rate relative to some peers adds further appeal to the bull thesis.
The Bearish Scenario: AI Spending Anxiety and Intraday Pressure
The bearish case for Meta stock centers on mounting AI spending concerns and deteriorating intraday technicals. These factors could undermine the daily uptrend.
The July 17 session’s 3.1% intraday drop was directly linked to broader AI-related selling. Investor anxiety over Meta’s massive AI spending is growing. That spending narrative cuts both ways. It drives the long-term growth story but also pressures near-term profitability perceptions.
Technically, failure to hold the $630 S1 daily pivot support would be a warning. A break back below the EMA200 at $633.89 would weaken the bullish case materially. A sustained close below those levels would suggest the consolidation has turned into a genuine reversal. The H1 chart already shows price struggling to reclaim its intraday moving averages. Prolonged failure there would increase the probability of a deeper retracement toward the $610–$613 EMA50 region on the daily.
Positioning in a High-Volatility Environment
Meta stock occupies a constructive but fragile position. The daily timeframe defines a bullish bias that remains technically valid. However, the hourly chart actively works against that thesis in the short term. This creates a window of uncertainty that requires careful navigation.
The daily ATR near $30 and the hourly ATR near $11 both signal high volatility. Outsized moves in both directions are plausible. Traders looking for long entries may want to wait for hourly momentum to stabilize. Price should reclaim at least the $649 EMA50 on the 1-hour chart before committing. Until then, the conflict between daily bullish structure and intraday bearish drift remains the defining tension in Meta stock.
FAQ
Is Meta stock still in an uptrend?
On the daily timeframe, yes. Meta stock closed at $646.01, above the EMA20 ($623.20), EMA50 ($612.83), and EMA200 ($633.89). The daily RSI at 56.8 and expanding MACD histogram confirm bullish momentum. However, the 1-hour chart shows bearish pressure that warrants caution.
What caused Meta stock’s 3.1% intraday decline on July 17?
The decline was linked to broader AI-related selling and rising investor anxiety over Meta’s massive spending on artificial intelligence initiatives. While the AI narrative drives long-term growth expectations, near-term profitability concerns weighed on the session.
What are the key support levels for Meta stock?
The S1 daily pivot support sits at $630.61, closely aligned with the EMA200 at $633.89. A sustained break below these levels would weaken the bullish case. The daily EMA50 at $612.83 and EMA20 at $623.20 provide additional structural support.
What fundamental catalysts support Meta stock?
Meta’s in-house Iris AI chip enters production in September, supporting a plan to double computing capacity to 14 gigawatts. Analysts cite Meta alongside Nvidia and Microsoft as one of the three biggest bargain stocks among the Magnificent Seven, noting cheap valuations relative to its growth profile.
{"@context":"https://schema.org","@type":"FAQPage","mainEntity":[{"@type":"Question","name":"Is Meta stock still in an uptrend?","acceptedAnswer":{"@type":"Answer","text":"On the daily timeframe, yes. Meta stock closed at $646.01, above the EMA20 ($623.20), EMA50 ($612.83), and EMA200 ($633.89). The daily RSI at 56.8 and expanding MACD histogram confirm bullish momentum. However, the 1-hour chart shows bearish pressure that warrants caution."}},{"@type":"Question","name":"What caused Meta stock's 3.1% intraday decline on July 17?","acceptedAnswer":{"@type":"Answer","text":"The decline was linked to broader AI-related selling and rising investor anxiety over Meta's massive spending on artificial intelligence initiatives. While the AI narrative drives long-term growth expectations, near-term profitability concerns weighed on the session."}},{"@type":"Question","name":"What are the key support levels for Meta stock?","acceptedAnswer":{"@type":"Answer","text":"The S1 daily pivot support sits at $630.61, closely aligned with the EMA200 at $633.89. A sustained break below these levels would weaken the bullish case. The daily EMA50 at $612.83 and EMA20 at $623.20 provide additional structural support."}},{"@type":"Question","name":"What fundamental catalysts support Meta stock?","acceptedAnswer":{"@type":"Answer","text":"Meta's in-house Iris AI chip enters production in September, supporting a plan to double computing capacity to 14 gigawatts. Analysts cite Meta alongside Nvidia and Microsoft as one of the three biggest bargain stocks among the Magnificent Seven, noting cheap valuations relative to its growth profile."}}]}
Article produced with the assistance of artificial intelligence and reviewed by the editorial team.
Disclaimer: The content of this article solely reflects the author's opinion and does not represent the platform in any capacity. This article is not intended to serve as a reference for making investment decisions.
You may also like
Shiba Inu tops $0.0000042 as exchange outflows and bullish derivatives boost sentiment
Oil: Escalation risks and Dollar support – OCBC
Czech Koruna: CNB stance supports CZK against Euro – ING
Elon Musk Says SpaceX Engineering Data Will Train Grok’s Next Model
Crypto prices
More


