
Why is gold falling amid geopolitical crises?

FX168 Financial News, August 4—— A decline in gold during geopolitical crises has never been a market paradox, but rather a manifestation of its pricing mechanism. Real interest rates, the US dollar, crowded positioning, and liquidity conditions explain nearly every major historical drop—including those that occurred amid war and panic.
Whenever international tensions rise, the narrative of gold as the "ultimate safe haven asset" sweeps across major media. However, a glance at the spot gold price chart often reveals a glaring bearish candle that starkly contrasts with the clamor of headlines—on January 29, 2026, gold hit a historic high of about $5,595, but despite the Hormuz crisis pushing Brent above $100 and US inflation surging to 4.2%, gold prices plummeted about 27% to around $4,080 in just a few months, marking the worst quarter in 13 years.
The crisis continues, yet gold keeps falling. This is not a "market failure," but a misreading of gold's pricing logic. Gold has never been a thermometer for fear; it is a zero-yield, dollar-denominated financial asset. Its price primarily follows the hard rules of interest rates, exchange rates, and liquidity—only secondarily does it respond to geopolitical turmoil.
Understanding the starting point of gold’s decline means accepting a basic fact: gold generates no profit, no dividends, and no coupon. Its entire return comes from price movement.
This means that holding gold always entails an "opportunity cost"—you are giving up the returns you could have earned from risk-free assets with the same funds.
Suppose you hold $100,000 worth of gold for one year, while the 1-year US Treasury yield is 4.5%. Opting for gold means you actively forgo a guaranteed $4,500 return. Gold must rise 4.5% in a year just to "break even." When yields rise to 6%, the bar is set even higher. For large institutions, when opportunity cost increases, reducing gold holdings is a matter of arithmetic, not sentiment.
This is the fundamental principle behind gold’s decline during geopolitical crises: the crisis itself is not enough to push gold prices higher—only when the crisis changes the "relative value of holding gold compared to other assets" does the price respond.
II. Five Major Downward Forces: From Mechanism to Market
In actual trading, the following five forces dominate gold’s pullback:
1. Rising bond yields
When cash and Treasuries begin to pay higher returns, gold’s "zero yield" disadvantage is amplified. Funds flow from gold to interest-bearing assets—not as a prediction, but as a rebalancing.
2. US dollar appreciation
Gold is globally priced in dollars. A rising US dollar index means buyers in major gold-consuming countries like India, China, and Turkey face higher local currency costs, causing physical demand to naturally shrink. While in extreme panic, gold and the dollar may rise together (both seen as last-resort liquidity), this is the exception, not the rule.
3. Return of risk appetite
When stocks and credit markets rebound, funds rotate from defensive to risk assets, rapidly compressing gold’s "safe haven premium."
4. Profit-taking
After a prolonged rally, long positioning is crowded. Any disruption can trigger traders to lock in profits; once selling pressure outpaces new buying, the trend becomes self-reinforcing.
5. Forced liquidation
This is the harshest and most misunderstood mechanism. If leveraged investors suffer losses elsewhere, they must quickly raise cash to meet margin calls. Due to its high liquidity, gold often becomes the first asset "sold for liquidity"—they aren’t selling what they want to sell, but what they can sell.
From March 9 to 19, 2020, gold crashed about 12% during a liquidity crunch—a classic example of this mechanism. By August that year, gold was hitting new highs above $2,060. The initial drop was mechanical; the subsequent rally was a return to fundamentals.
Scenario 1: Why does gold fall when inflation is high?
This is the most searched question by novice traders. In theory, gold is an inflation hedge; in reality, high inflation often triggers a hawkish turn by central banks. The market starts pricing in rate hikes instead of cuts, nominal yields rise faster than inflation expectations, and real rates move positive—fatal for gold.
The 2026 correction was textbook: The Hormuz crisis pushed oil and inflation higher, but the Fed’s hawkish rate outlook reshaped the real rate curve, sending gold lower through a sustained crisis.
Key insight: Gold hedges "surprise inflation" and "currency credibility collapse," not "inflation actively being fought by central banks."
Scenario 2: Why does gold fall alongside equities at the onset of a market crash?
This is not the demise of the safe-haven narrative, but a result of market mechanics. On the eve of real panic, margin calls force leveraged investors to indiscriminately sell the most liquid assets. Gold’s liquidity makes it the "cash withdrawal machine."
Scenario 3: Why does gold keep falling even after tensions ease?
The market prices expectations—not events. "Buy the rumor, sell the fact" is an eternal game. Geopolitical risk premiums accumulate during escalation and unwind as tensions ease. Once diplomacy removes uncertainty, speculative long positions taken earlier are unwound regardless of whether conflict persists, putting pressure on gold.
Physical demand: China and India's "price sensitivity"
About half of annual global gold demand comes from jewelry, dominated by China and India. When local gold prices soar, rational consumers hold off—delaying or reducing wedding season purchases, increasing old-gold recycling. Supply enters the market at moments of weakest demand. Of course, demand also "migrates": In Q1 2026, Indian gold demand grew 10% year-on-year to 151 tons, but funds shifted from jewelry to bars, coins, and digital gold.
Institutional flows: ETFs and central banks
Switches in institutional flows move prices more than retail buying. Redemptions from gold ETFs force managers to sell physical gold, falling prices trigger more redemptions—a negative feedback loop. Speculative futures unwinding further intensifies pressure.
Central banks play the opposite role. In 2025, global central bank net gold purchases totaled about 863 tons, the fourth highest on record, providing a structural market floor. The real risk isn’t central bank selling (now extremely rare) but rather a slowdown in buying—when the steadiest buying thins, the market becomes more susceptible to speculative flows.
Common factors in five historical gold crashes
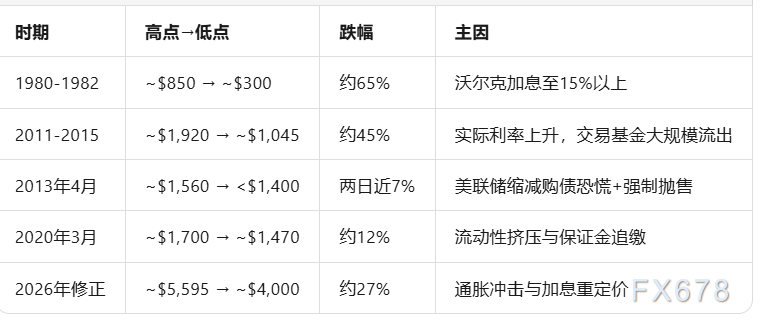
Across decades, every deep pullback bears the same fingerprints: rising (or expected rising) real rates, crowded prior long positions, leverage magnifying declines, and bullish narratives still loudly proclaimed during sell-offs. After peaking in 1980, gold didn’t recover until January 2008—a 28-year wait, enough for any unsophisticated top buyer without a plan to pay a painful price.
For non-US investors, currency is a commonly overlooked dimension. Gold is dollar-priced, but your returns are settled in local currency.
Take Malaysian ringgit, for instance:
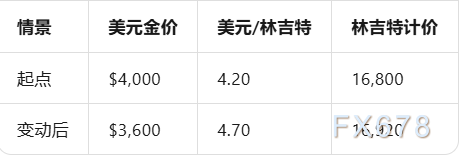
If US dollar gold falls 10%, but the ringgit depreciates 11.9%, local investors actually gain 0.7%. That’s why international headlines and your local gold price often "sing opposite tunes." Historically, gold provides the best protection for savers in countries suffering currency devaluation.
Practical tip: Open both the gold/USD and your local currency’s exchange rate chart (e.g., USD/ringgit) on mainstream platforms, then multiply the two to get gold priced in your local currency. It’s advisable to observe monthly trends to filter out daily noise.
VI. Trading in a Falling Market: From "Prediction" to "Conditional Thinking"
Traders often ask: Will gold go up or down next? The honest answer: no one knows. Major banks’ 12-month gold targets often differ by more than 25%. A better approach is conditional thinking—not predicting, but defining "what scenarios dominate under what conditions":
If real rates fall and the dollar weakens → bullish for gold
If inflation is sticky and central banks keep tightening → headwinds persist
If a liquidity event hits → drop then recovery
If central banks keep buying → downside is limited
Two-way trading and risk control
Bear markets are bad news only for those who can "only go long." Gold CFDs allow for two-way positions, meaning declines can be traded directly.
But leverage is a double-edged sword. Professional traders control risk by "working backward from risk to position size, not amplifying based on conviction":
Account balance $5,000 → 1% per trade at risk = $50 → planned stop loss distance $25 → risk per lot $2,500 → correct position size: 50/2,500 = 0.02 lots
During crises, gold’s daily volatility may double; stop loss levels must widen, and positions must be reduced to keep cash risk constant. Every position should have a stop loss; reduce leverage during high volatility and stay clear of large positions before major data releases—write a trading log to distinguish between "bad luck" and "bad process."
Bonus tool: The gold/silver ratio can serve as a relative value indicator. At historical highs, some traders consider increasing silver and reducing gold in anticipation of mean reversion. But remember, silver is more volatile and industrial, so risk is higher.
A decline in gold during geopolitical crises has never been a market paradox, but rather a manifestation of its pricing mechanism. Real interest rates, the US dollar, crowded positioning, and liquidity conditions explain nearly every major historical drop—including those that occurred amid war and panic.
Once you understand these drivers, red candles on the chart are no longer an ironic sign of the "safe haven myth broken," but readable and actionable market signals. Gold never prices fear; it prices "holding cost" and "alternatives." Remember this, and you will be ahead of most traders chasing headlines.
Disclaimer: The content of this article solely reflects the author's opinion and does not represent the platform in any capacity. This article is not intended to serve as a reference for making investment decisions.
You may also like
Report: The production capacity of the three major storage manufacturers for 2027 is already sold out in advance, confirming that "next year will be the most supply-short year for storage"
According to DIGITIMES, the entire annual production capacity of DRAM and HBM from Samsung, Micron, and SK Hynix for 2027 has already been fully allocated, and the NAND Flash capacity has also been nearly sold out in advance. Previously, SK Group warned that 2027 will see the most severe supply-demand imbalance in history. Although price increases are expected to slow down compared to 2026, "high prices becoming the norm" has already become a new normal, and those who have not locked in supply ahead of time will face a shortage and inability to purchase.
Can the yen be supported by the joint efforts of the US and Japan? Wall Street believes that "if Japan doesn't raise interest rates, any intervention is useless"
The United States and Japan coordinated intervention in the yen, using nearly $100 billion over two days—the largest amount on record—but the effects have already begun to fade. Institutions such as Goldman Sachs believe that the root cause of the yen's depreciation lies in Japan's high debt suppressing interest rate increases, as the Bank of Japan is reluctant to actually raise rates and the intervention can only buy time. Goldman Sachs predicts that the Bank of Japan’s next rate hike may be delayed until January 2027, at which point carry trades will return and the yen could weaken sharply again. The US Treasury will also face losses from this intervention.
After the collapse of the South Korean stock market, retail investors "lost confidence": Remember two principles—First: do not buy Korean stocks, Second: adhere to the first rule.
In July, the Korean stock market plunged by 22%, suffering a historic crash. Previously, driven by FOMO sentiment, retail investors heavily bought into AI-related stocks such as Samsung and SK hynix, and leveraged their positions with single-stock leveraged ETFs introduced by the government, resulting in severe losses. Analysts warn that deleveraging and volatility in semiconductor stocks may persist for several months, and that rebuilding market confidence will require a longer period of recovery.
Data center "power engine" experiences explosive growth! The AI surge spills over to the power supply chain; ON Semiconductor (ON.US) Q2 cash flow quadruples and outlook beats expectations
The company's AI data center "Power Engine" business has completely taken off—demand for power management chips used in artificial intelligence data centers has surged, driving the company's stock price to soar by more than 7% in after-hours trading on the US stock market.

Crypto prices
More


