Crypto Scholar: 8.5 Ethereum (ETH) Consolidation Battle Surges Beneath the Surface—Is the Breakout Window Approaching? Latest Market Analysis Reference
Ethereum is currently priced at 1870. The market hasn't shown a clear unilateral movement yet, and the overall direction is still in contention. Many people always want to catch the big moves in one go but overlook that in a consolidation phase, blindly chasing upward or downward is most inadvisable. Don't get overheated and chase longs during big rallies, nor panic and blindly short during sharp declines. The key to trading in a consolidation is not high profit but position management and patience. After a major downturn, the price enters a recovery phase, with bulls and bears tugging back and forth. Opportunities lie at crucial support and resistance levels. Entering blindly without clear signals can easily result in repeated losses. Rather than frequent trading and depleting your capital, it's better to patiently wait for the market to provide a clear direction.
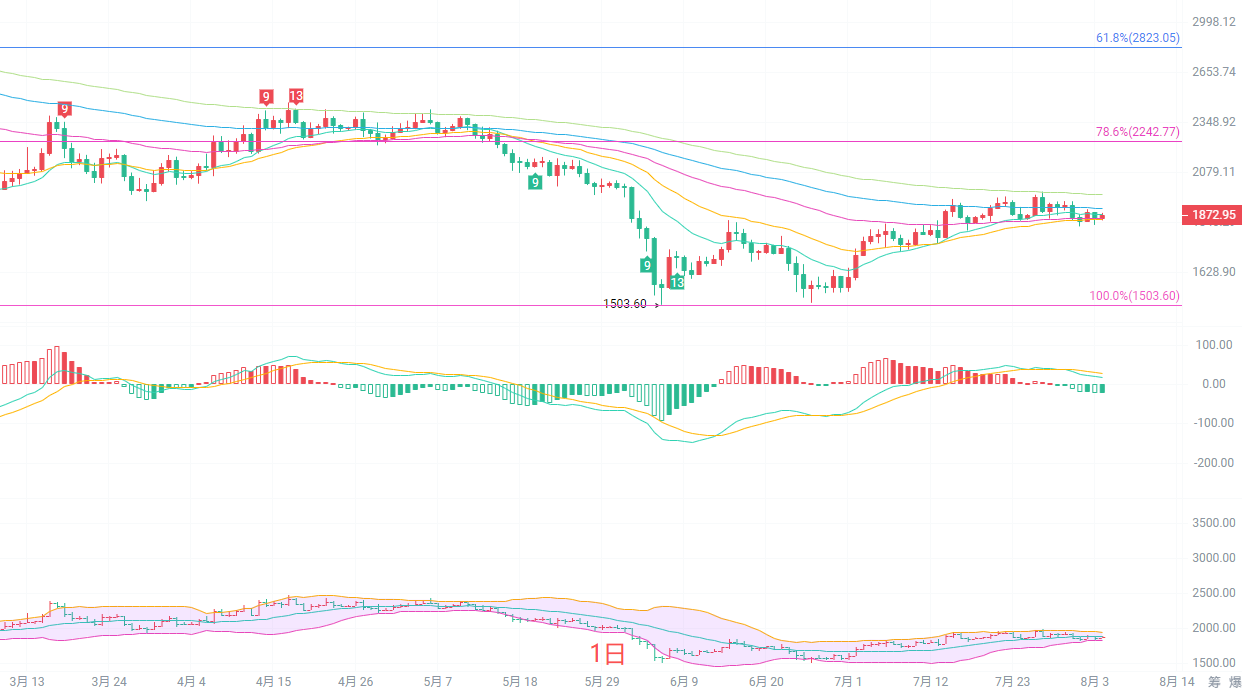
On the daily K chart, the current price is consolidating below the 78.6% Fibonacci resistance. The short-term EMA30 is around 1854, with the price moving just above the short-term moving average, and the curve is starting to turn upwards—showing a recovery and rebound after the decline. The MACD indicator's DIF and DEA are below the zero axis with a slight increase in red bars, indicating some recovery on the bull side but not yet dominance. The Bollinger Band midline is at 1886, upper at 1948, lower at 1824, with price close to the middle band. On the daily chart, there is strong resistance at 2242 above and key support at 1503 below. As long as key ranges are not broken in the short term, it remains a rebound recovery and has not yet fully reversed the major downward trend.
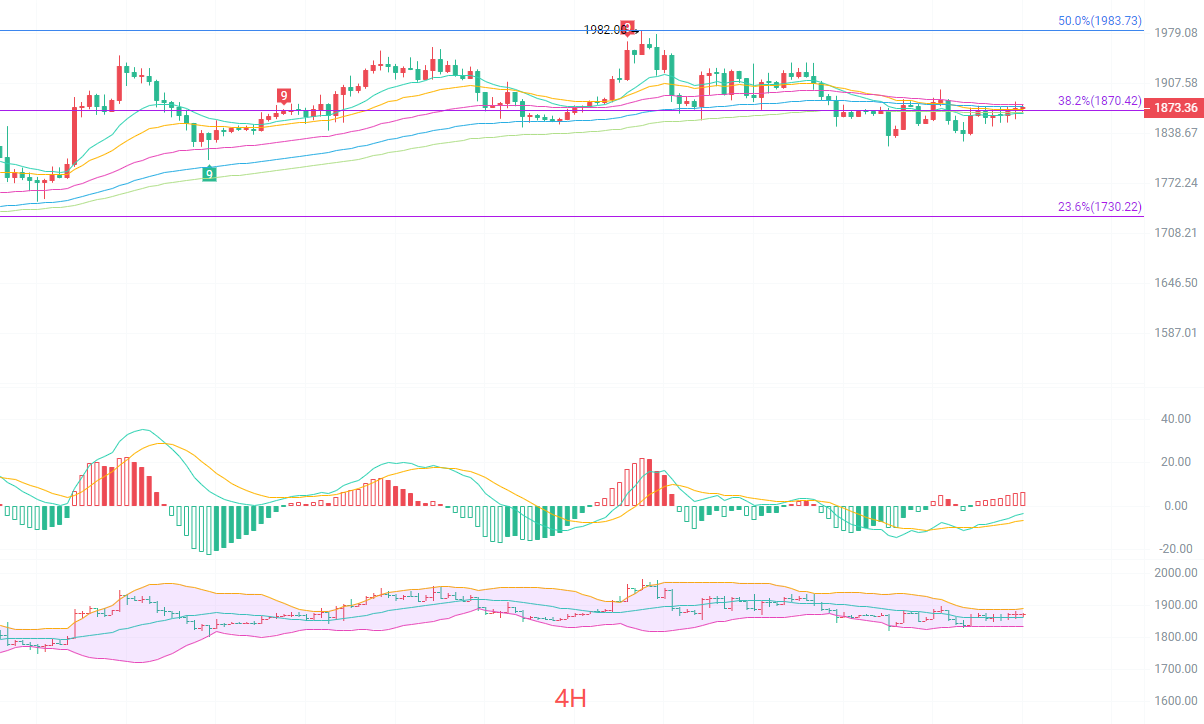
The four-hour K chart is hovering near the 38.2% Fibonacci retracement at 1870. EMA15, EMA30, and EMA60 are intertwined, and their convergence signals increased contention between bulls and bears, with the market about to choose a direction. The upper short-term resistance is at 1982, which is the high point of the current rebound, and the first support below is at 1730. The MACD swings back and forth near the zero axis, with red and green bars alternating and no sustained rising momentum—a classic consolidation feature. The Bollinger midline is at 1862, current price right at the middle band, upper at 1889, lower at 1835: the whole channel is narrowing and volatility is compressed. If the 4-hour chart can hold above 1870, there is the opportunity to test the 1982 high; if support at 1835 is lost, price may again retest the 1730 zone.
Short-term reference:
If the 1800 to 1850 zone below holds, stop loss at 1760, target 1880 to 1920.
If resistance from 1980 to 2020 above holds, stop loss at 2050, target 1930 to 1890.
Take actual trades based on live market data. For more information, consult the author directly. Articles are published with some delay, so advice is for reference only. Trade at your own risk.