
In Luckin Coffee’s Q2 report, we saw signs that growth has peaked.


On the evening of August 3, 2026, Beijing time, Luckin Coffee released its financial report for the second quarter of 2026. Ahead of the earnings release, the company's stock price continued to rise amid expectations of record revenue, but following the Q2 earnings announcement, capital markets saw intensified volatility and fierce long vs. short battles.
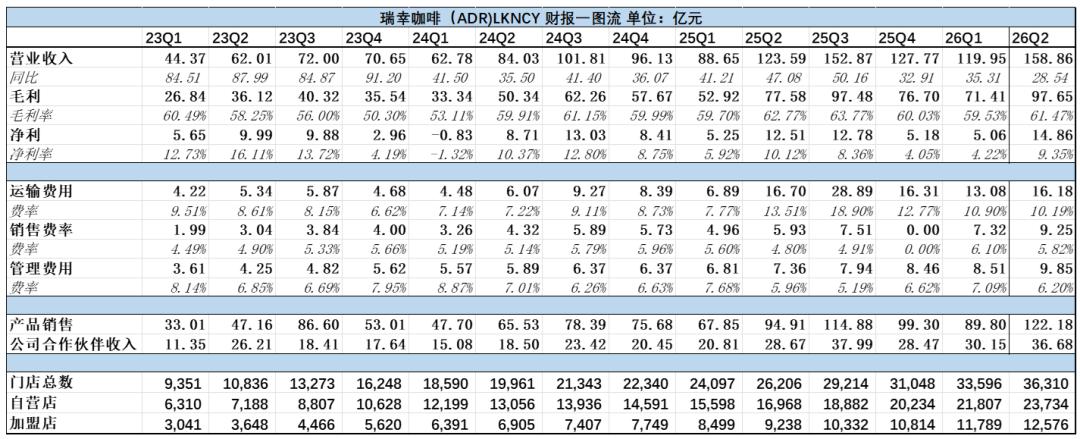
In Q2 2026, Luckin Coffee achieved total net revenue of RMB 15.886 billion, up 28.5% year-over-year, exceeding market expectations—the Bloomberg consensus was RMB 15.43 billion, and actual revenue surpassed this by about RMB 460 million.
In terms of gross profit, the overall gross margin for Q2 2026 was about 61.5%, up 1.7 percentage points year-over-year and remained at a high level.
As for profits, GAAP net income for Q2 2026 was RMB 1.486 billion, an increase of 16.1% year-over-year; Non-GAAP net income (excluding non-cash items such as equity incentives) was RMB 1.753 billion, up 22.8%. The net margin was 9.4%, down approximately 1 percentage point from 10.4% in the same period of 2025. The slower profit growth relative to revenue growth was mainly affected by rising coffee bean costs and rigid expenses brought by rapid store expansion.
Overall, Luckin Coffee maintained strong revenue growth momentum in Q2 2026, with all core indicators surpassing market expectations.
Below is a one-chart summary of the results; all data sourced from Wind (in billions of RMB throughout).
Our core viewpoints are as follows:
Single-store efficiency is showing marginal declines, but scaling up can still provide impressive growth. Q2 revenue exceeded expectations at RMB 15.886 billion, but was mainly driven by the accelerated expansion of 36,000 stores nationwide; old-store same-store sales growth (SSSG -5.3%), single-store average daily revenue (-9.5%), and single-store monthly customer coverage (-11.6%) all posted double-digit declines.
Narrowing discounts and a high self-pickup ratio are driving “cost reduction and efficiency improvement” on the profitability side. Thanks to the actual selling price (ASP) slightly recovering to the RMB 11.9–12.9 range, and the “downstairs self-pickup” from high-density coverage substituting for high-cost delivery, the delivery fee rate dropped by 3.3 percentage points year-on-year to 10.2%. Non-GAAP net profit reached RMB 1.753 billion (+22.8%), as Luckin is gradually moving past the impact of the “RMB 9.9 price war.”
Overall, Luckin’s Q2 financial report is good, but mainly answers the market’s concerns about the scale boundary and price wars, while the contraction in single-store productivity also exposes underlying issues.
Financial analysis as follows.
01
Scale up, single-store down
Luckin’s total revenue this quarter exceeded market expectations. In Q2 2026, the company achieved net income of RMB 15.886 billion, up 28.5% year-on-year; total GMV for the same period was RMB 18.4 billion, up 29.8% year-on-year.
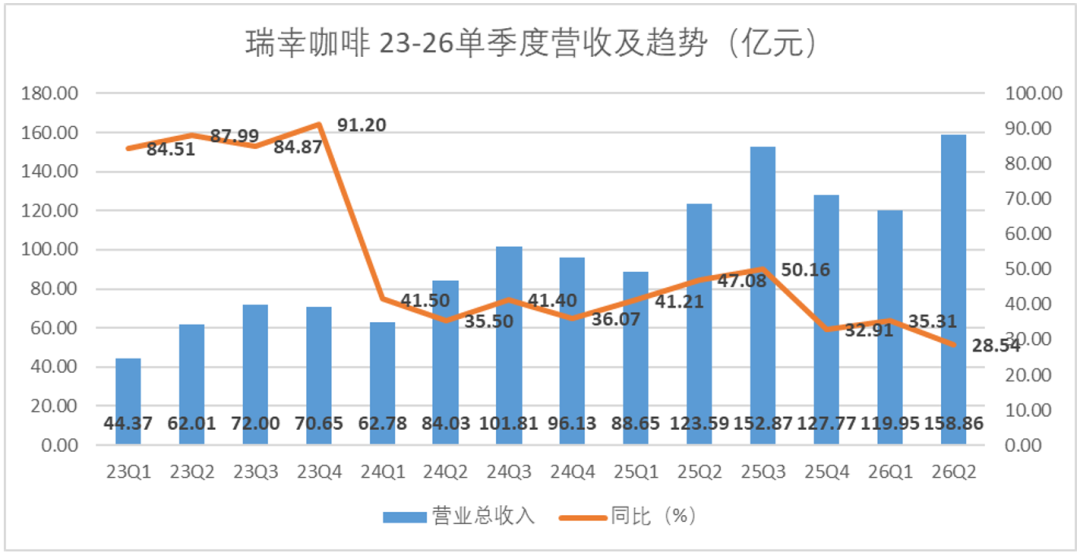
Overall, this quarter’s revenue shows growth mainly driven by scale, with a strong total performance, but growth momentum seems to be peaking, and single-store dilution implies pressure on growth quality. We analyze this from the perspectives of business revenue structure and store operational quality:
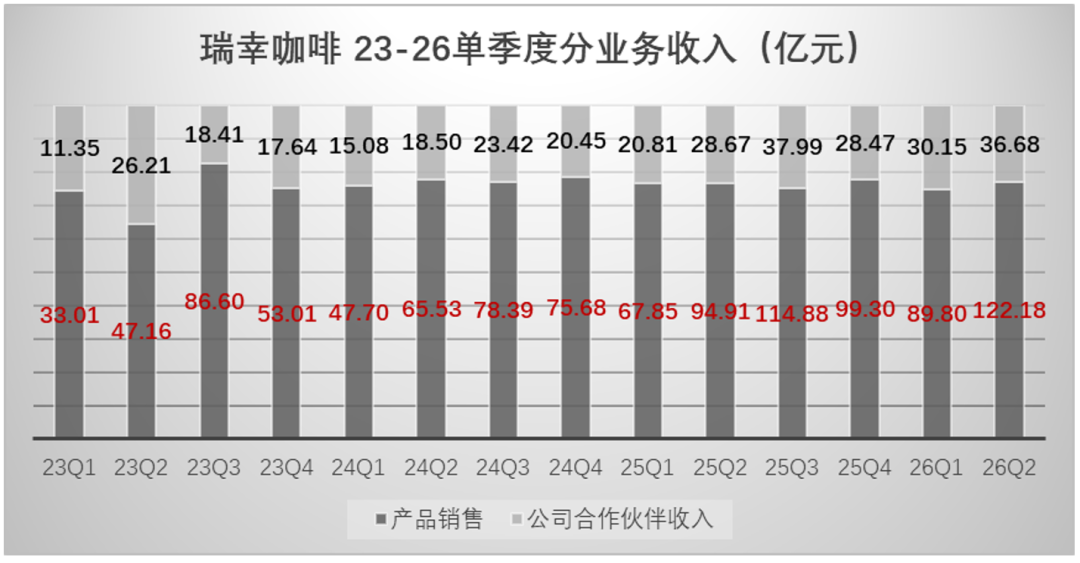
Breaking down the revenue, product sales revenue (self-operated stores and official online channels) and company partner revenue (franchise income) both posted marked increases this quarter.
In Q2 2026, product sales revenue was RMB 12.218 billion, up 28.73% year-over-year, but growth slowed by 15.8 percentage points compared with Q2 2025. Ready-to-drink beverage revenue reached RMB 11.155 billion, accounting for 70.2%. Core self-operated store revenue came in at RMB 11.564 billion, up 26.6% year-on-year, but same-store sales growth (SSSG) for self-operated stores was about -5.3%, declining for three consecutive quarters.
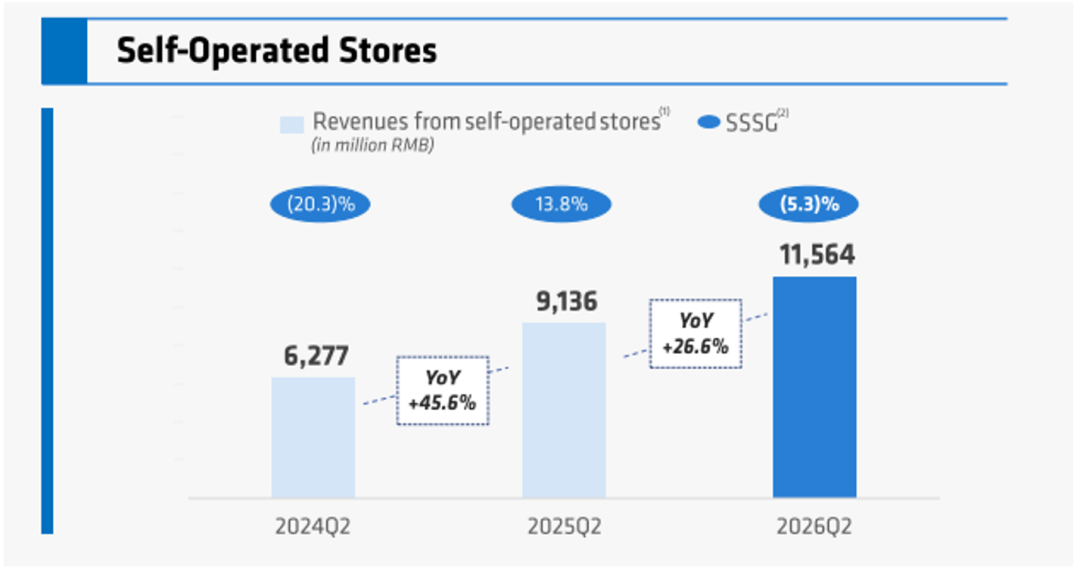
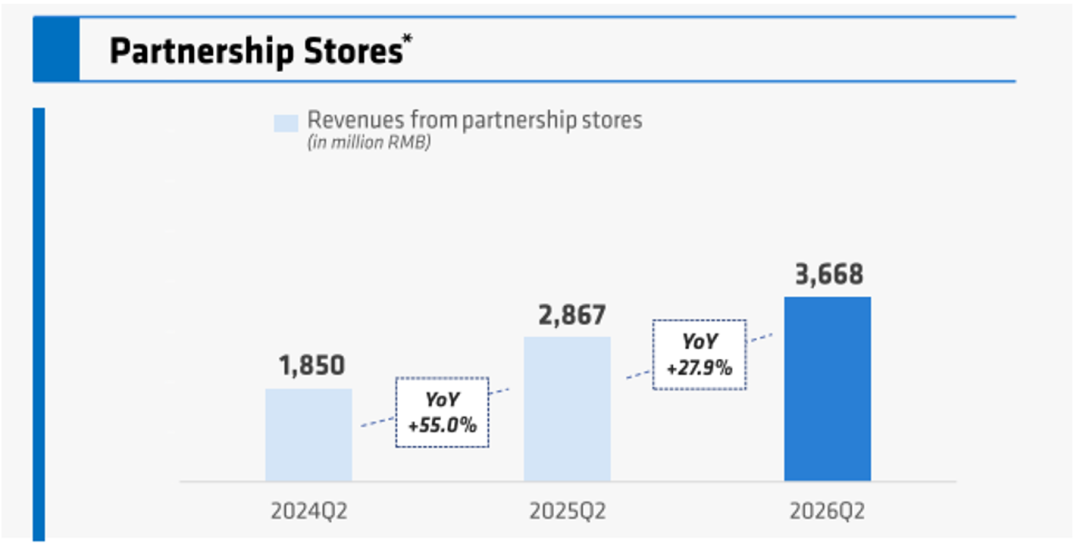
Over the same period, company partner revenue was RMB 3.668 billion, up 27.94% year-over-year, but growth was down by 27.03 percentage points compared to Q2 2025. Franchise store revenue was RMB 3.668 billion, up 27.9%, but growth slowed by 27.1 percentage points from Q2 2025.
Revenue growth was mainly driven by both store expansion and an increase in monthly active customers:
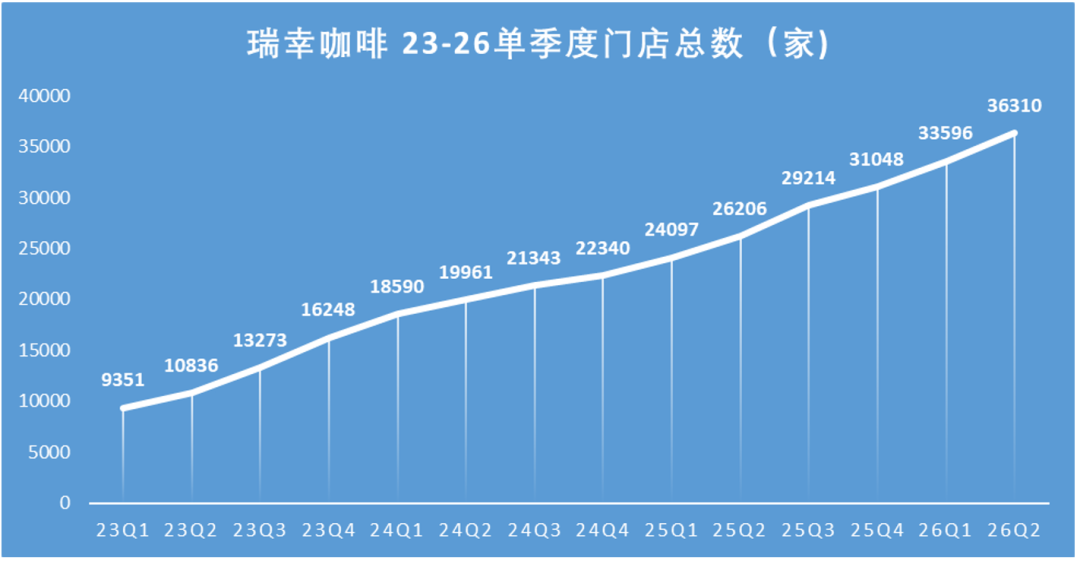
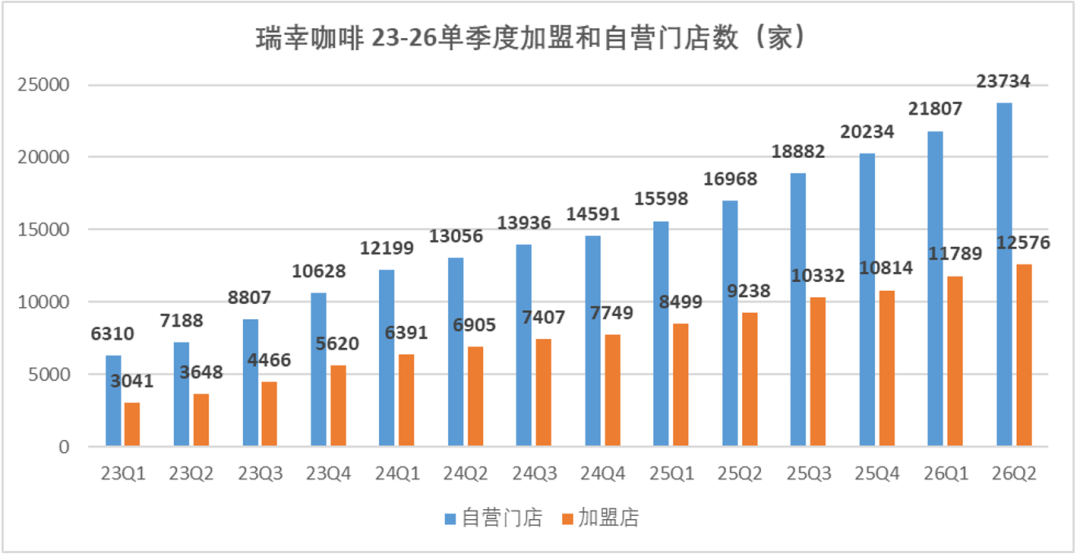
In Q2 2026, Luckin’s global store count reached 36,310, with a net increase of 2,714 stores for the quarter. Of these, 23,734 were self-operated and 12,576 were franchised.
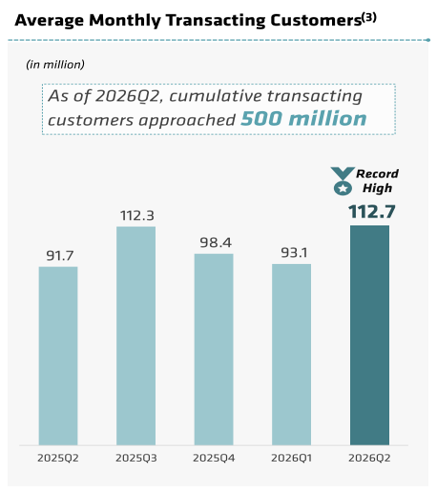
Average monthly transacting customers this quarter reached 112.7 million, up 22.9% year-over-year, with more than 25 million new transacting customers added in the single quarter. As of the end of Q2 2026, Luckin’s cumulative transacting customers approached 500 million, and monthly cup purchases per customer reached a record high.
The flip side of continuous scaling is a simultaneous slowdown in revenue growth and single-store performance. The core reasons are twofold:
(1) External factors: Absorbing the high-base effect of Q2 2025. That quarter was boosted by food delivery platform subsidies, leading to explosive growth in online sales and GMV, thus setting a high base.
(2) Internal factors: “Internal diversion effect” arising from increased store density. Combining store data and user metrics, we estimate both single-store revenue and monthly customer service per store this quarter. The results show significant dilution in per-store performance due to dense new openings:
On a per-store basis, in Q2 2026, average quarterly revenue for self-operated stores was about RMB 487,000, with average daily revenue per store of about RMB 5,414. In Q2 2025, self-operated store revenue was RMB 9.136 billion with 16,968 stores at quarter end, meaning average revenue per store was about RMB 538,000 per quarter, or about RMB 5,982 per day. Average daily revenue per store thus fell by about 9.5% year-over-year. The number of self-operated stores grew about 40% year-over-year, but total income from these stores rose only 26.6%—increasing store count outpaced revenue growth, making declining per-store output almost inevitable.
For customer coverage per store, using the quarterly average of 34,953 stores, each store served about 3,224 monthly transacting customers this quarter, compared to 3,646 per store per month in the same quarter of 2025—a drop of 11.6%. Total store count increased approximately 39% year-over-year, but total transacting customers grew only about 23%—meaning store growth far outpaced customer growth, so falling per-store customer coverage is to be expected.
This quarter, Luckin maintained overall revenue growth thanks to a high-density opening network and large numbers of new users, but the pressure on old stores (in same-store growth), the decline in per-store output, and the drop in per-store customer service numbers all suggest the company is facing the challenge of diminishing marginal gains from adding more stores.
02
Exit of price war, profit recovery beat expectations
This quarter, Luckin Coffee achieved gross profit of about RMB 9.77 billion, with an overall gross margin of 61.5%, an industry-leading level. Compared to the same period in 2025, gross margin improved by about 1.7 percentage points year-on-year.
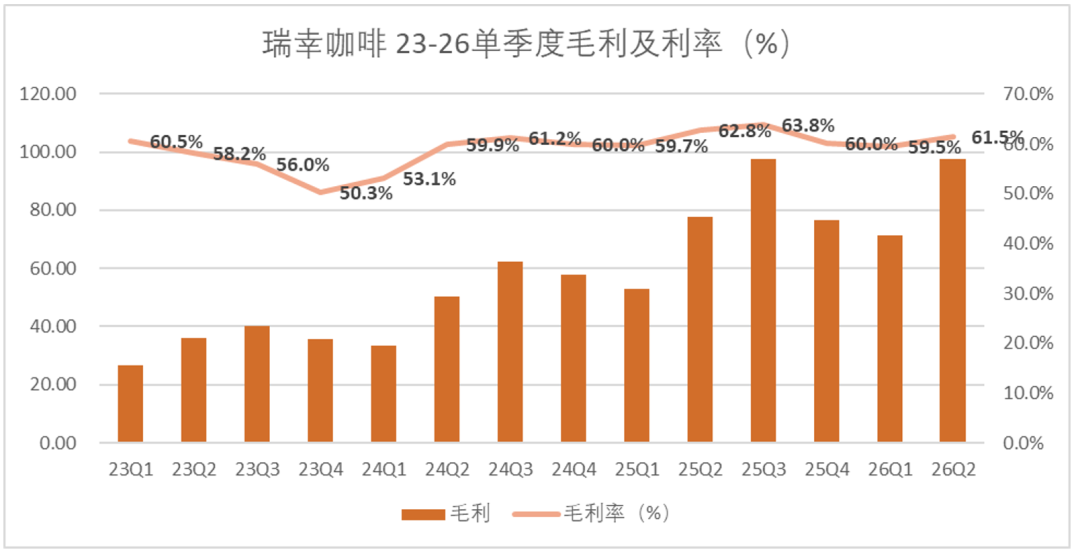
Gross margin improved this quarter mainly due to a rebound in the actual selling price (ASP) and tighter discount control.
Compared with the previous across-the-board RMB 9.9/cup aggressive subsidy strategy, Luckin applied a more refined tiered pricing strategy this quarter. By reducing large coupon issuance for some regular and popular products and raising the actual payment threshold (such as to the RMB 11.9–12.9 range), Luckin achieved a slight rebound in ASP.
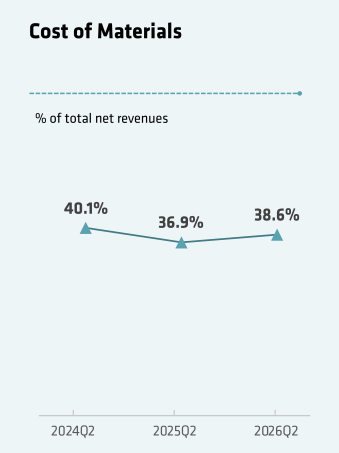
Raw material costs were relatively stable in Q2, with material cost rate increasing by 1.7 percentage points year-on-year to 38.6%. The rapid expansion on the revenue side diluted the pressure from rising material costs, keeping gross margin high.
For net profit, GAAP net profit was RMB 1.486 billion for the quarter, up 16.1% year-over-year; Non-GAAP net profit was RMB 1.753 billion, up 22.8%. The GAAP net margin was 9.4%, down about 1 percentage point from 10.4% in Q2 of 2025.
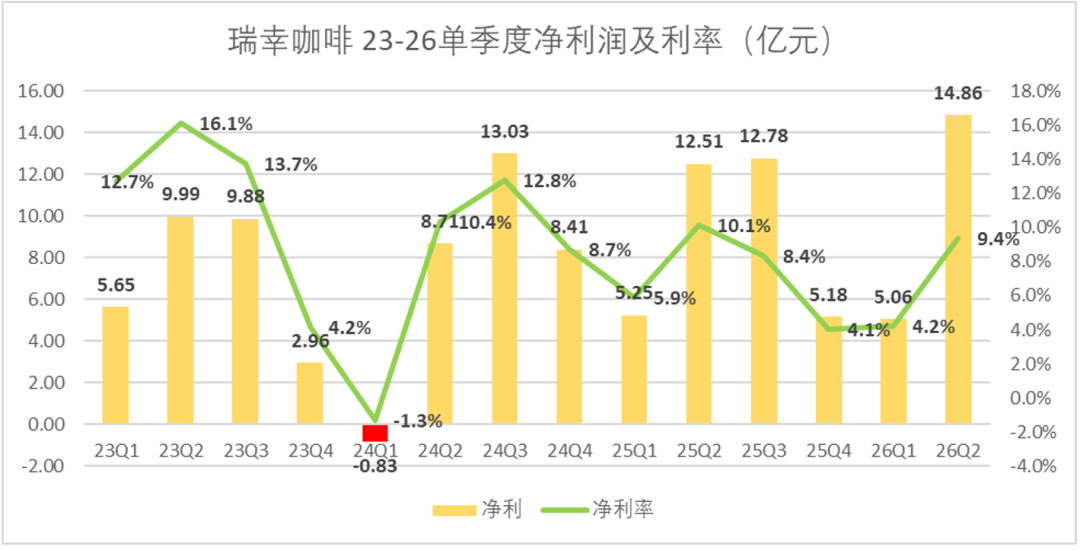
This substantial net profit improvement was largely due to effective expense control, particularly in optimizing delivery costs.
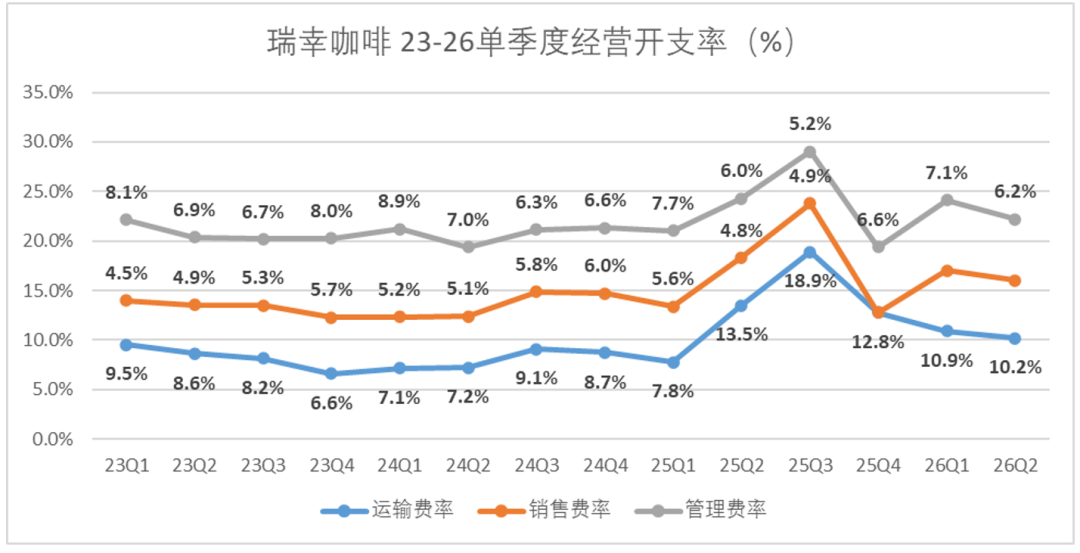
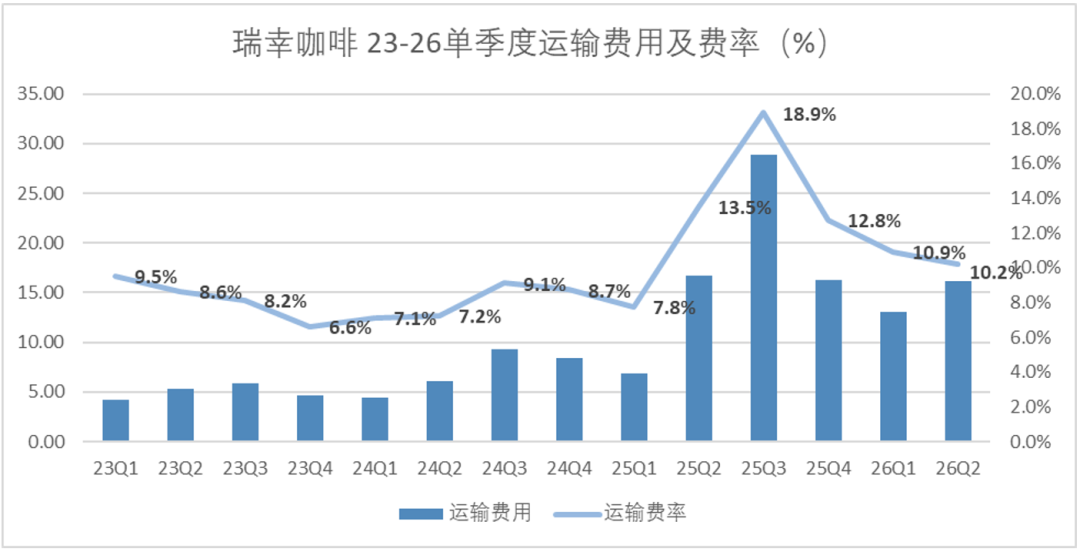
Q2 2026 delivery costs were RMB 1.619 billion, with a fee rate of 10.2%, down 3.3 percentage points year-over-year. There were two main reasons for the fall in the delivery fee rate:
First, as food delivery subsidies subsided, the proportion of deliveries dropped significantly, and the share of store self-pickup orders, which do not incur delivery fees, rose sharply. Since self-pickup orders generate no third-party delivery costs, the change in order structure directly pushed down the overall delivery fee rate.
Second, dense store coverage brought a “go downstairs for self-pickup” substitution effect. With most Luckin stores covering areas within 100 meters, scenarios previously relying on delivery were directly replaced by convenient self-pickup. Enhanced consumer willingness for self-pickup fundamentally reduced reliance on delivery.
03
Addressing the present, evading the future
In summary, we believe Luckin’s Q2 report effectively answered two questions:
First, the benefits of large-scale expansion are far from over.
The ceiling for China's coffee market remains very high. In Q2 2026, Luckin’s global store count reached 36,310, with a net increase of 2,714 stores for the quarter—translating to an average of about 30 new stores every day. At the same time, revenue growth stayed close to 30% despite a high comparison base, proving that the scale-up dividend in freshly made coffee is far from exhausted.
Second, effective growth can be achieved without relying on RMB 9.9 subsidies.
In Q2, Luckin’s overall ASP improvement drove margin up to 61.5%. Against a backdrop of a marked decline in delivery subsidies, monthly transacting users hit a record 113 million, and “downstairs self-pickup” via high-density store coverage replaced high-cost delivery, directly cutting delivery fee rate by 3.3 percentage points to 10.2% and effectively improving expense ratios.
But there are also questions that Luckin’s Q2 report does not address, such as the declines in per-store productivity and per-store customer numbers, revealing the marginal limits of scaling.
The post-earnings long vs. short battle over the stock price essentially reflects a sharp clash in the capital market over Luckin’s valuation logic: bulls betting on its 36,000-store moat and supply chain cost reduction ability, bears questioning the diminishing marginal quality of growth given continual same-store sales declines. The core disagreement is a narrative battle between “absolute scale advantage” and “the per-store output ceiling.”
From a valuation perspective, if we estimate Non-GAAP net profits of RMB 5.5–6 billion for full-year 2026, Luckin’s current dynamic P/E on the US OTC market is just 15–18 times. This valuation is already very close to that of mature restaurant chains such as Yum China.
Looking ahead, whether Luckin can break through its current valuation ceiling depends on its ability to deliver on two things:
Domestically, can it halt the decline in same-store SSSG through product portfolio iteration (such as bottled coffee, SOE specialty drinks, and so on) and achieve a rebound in per-store output? The market response to new products will directly impact when SSSG rebounds.
Overseas, can it replicate at scale the “digital self-pickup + optimized supply chain” model proven in China in regions such as Southeast Asia and the Middle East to deliver a second growth curve? Currently, Luckin operates 223 overseas stores with very limited revenue contribution—not reported separately in the financials—and international expansion remains at a pilot stage, unlikely to deliver substantial growth in the short term.
Until a full transformation is achieved, Luckin’s share price may continue to fluctuate significantly within the current valuation range, with a pattern of “value recalibration” highly dependent on earnings delivery. This Q2 financial report answers whether Luckin can make money—but the question of whether it can continually make more money will require a few more quarters to find out.

Disclaimer: The content of this article solely reflects the author's opinion and does not represent the platform in any capacity. This article is not intended to serve as a reference for making investment decisions.
You may also like
"Balance Sheet Reduction ≠ Tightening"! Morgan Stanley Explains the Fed's "Asymmetric Balance Sheet Reduction" in Detail
Does balance sheet reduction equal tightening? Morgan Stanley believes the market has fundamentally misunderstood. The Federal Reserve may reduce its balance sheet by $1.5 trillion in the future, but with multiple tools at its disposal, it can achieve a smooth landing without raising interest rates or impacting the market. Balance sheet reduction is by no means automatically negative, and traditional bearish logic urgently needs to be reshaped.
Litecoin holds $46, eyes $47.60 as MWEB adoption rises
Earnings Preview | Revenue May "Miss the Mark" but Gross Margin Could "Soar" — Super Micro Computer (SMCI.US) Q4 Earnings Will Test the Strength of the AI Computing Power Chain
Super Micro Computer (SMCI.US) will release its Q4 FY2026 financial report after the U.S. market close on August 11 (Tuesday).

BlackRock CEO Larry Fink warns against keeping money in banks
Crypto prices
More


