ETH enters the new week at $1,878.72, carrying the weight of its tightest trading range in months and its first negative ETF week in over a month. A symmetrical triangle on the daily chart has reached its apex, meaning the next directional move is close, and the question is whether record-low sell exhaustion catches a bid or one final flush clears the way.
ETH spent the entire week bouncing between roughly $1,855 and $1,930, a 50 to 70 point range that produced no decisive move in either direction.
Every push above $1,930 was rejected, and every dip toward $1,855 found buyers. The result was the tightest weekly compression of 2026.
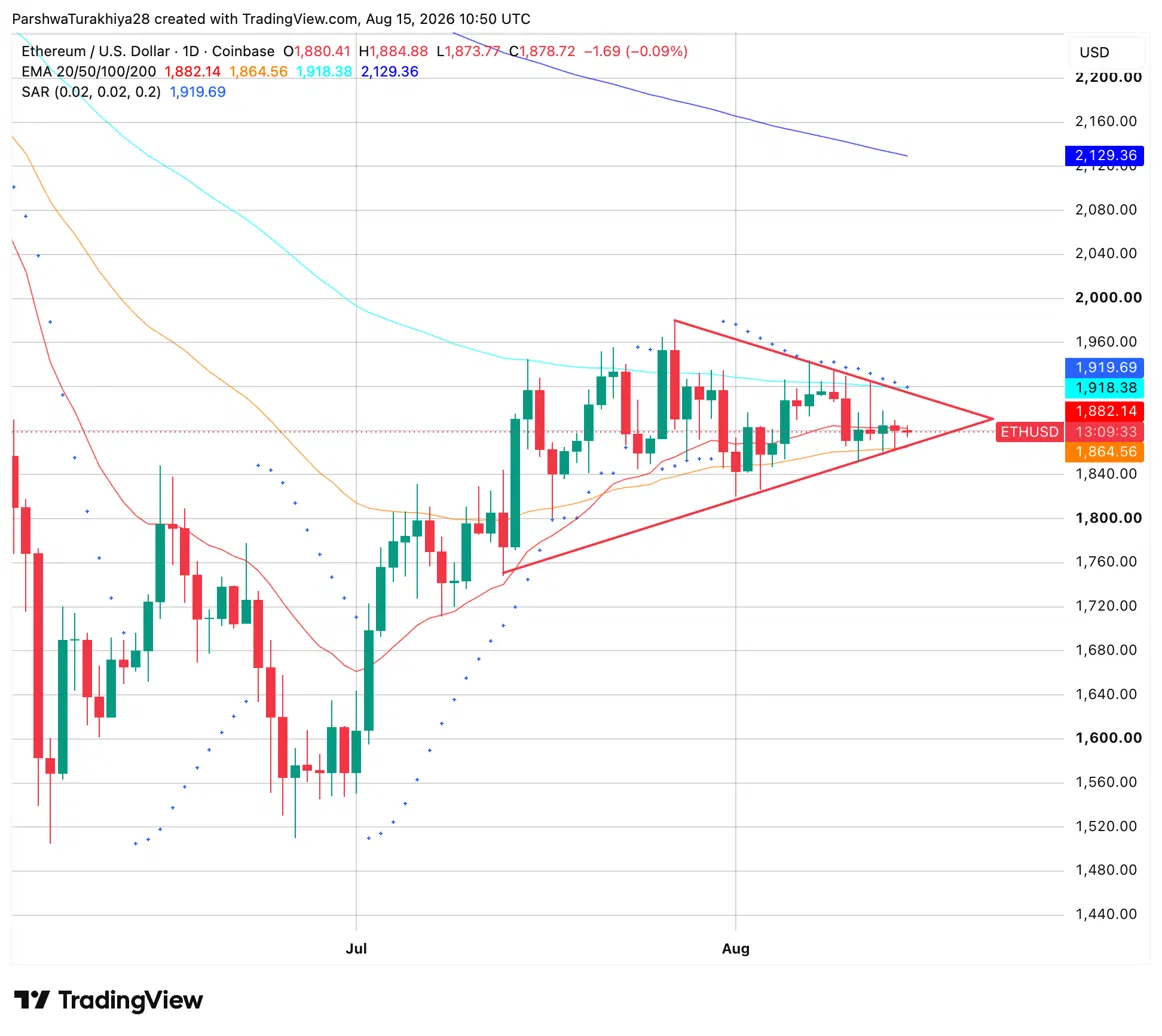
The daily chart shows ETH sitting exactly at the apex of a symmetrical triangle formed between the July highs and the August pullback lows. Today’s session opened at $1,880.41, pushed to $1,884.88, and is holding at $1,878.72, right at the convergence point of both trendlines.
The 20-day EMA at $1,882.14 sits almost exactly at the current price, making today’s close the first meaningful test of whether buyers can hold that level. The Parabolic SAR at $1,919.69 and the 100-day EMA at $1,918.38 form a tight resistance cluster just above, and a daily close through that zone is the condition for the triangle to resolve to the upside. The 50-day EMA at $1,864.56 is the first support below, and if that gives way, the triangle lower boundary near $1,800 becomes the next floor. The 200-day EMA at $2,129.36 is the longer-term target if the breakout confirms.
| Type | Price | Level |
| Resistance | $1,918 to $1,920 | Parabolic SAR and 100-day EMA cluster |
| Resistance | $1,960 | Triangle upper boundary and prior high |
| Resistance | $2,129 | 200-day EMA |
| Support | $1,864 | 50-day EMA |
| Support | $1,837 | 0.382 Fibonacci |
| Support | $1,800 | Triangle lower boundary |
Spot ETH ETFs posted a $2.26M weekly net outflow for the week ending August 14, snapping five consecutive weeks of net inflows that had brought in $244.94M, $27.42M, $103.90M, $105.44M, and $84.42M respectively.
Every single product recorded zero daily flow on August 14, the cleanest flat session in weeks. Cumulative net inflows hold at $11.45B with total net assets at $10.52B.
| Week | Weekly Net Flow |
| Aug 14, 2026 | -$2.26M |
| Aug 7, 2026 | $244.94M |
| Jul 31, 2026 | $27.42M |
| Jul 24, 2026 | $103.90M |
Meanwhile, ETH spot netflow registered -$3.48M on August 15, meaning more ETH moved off exchanges than onto them, a modestly bullish supply signal that runs counter to the ETF outflow picture.
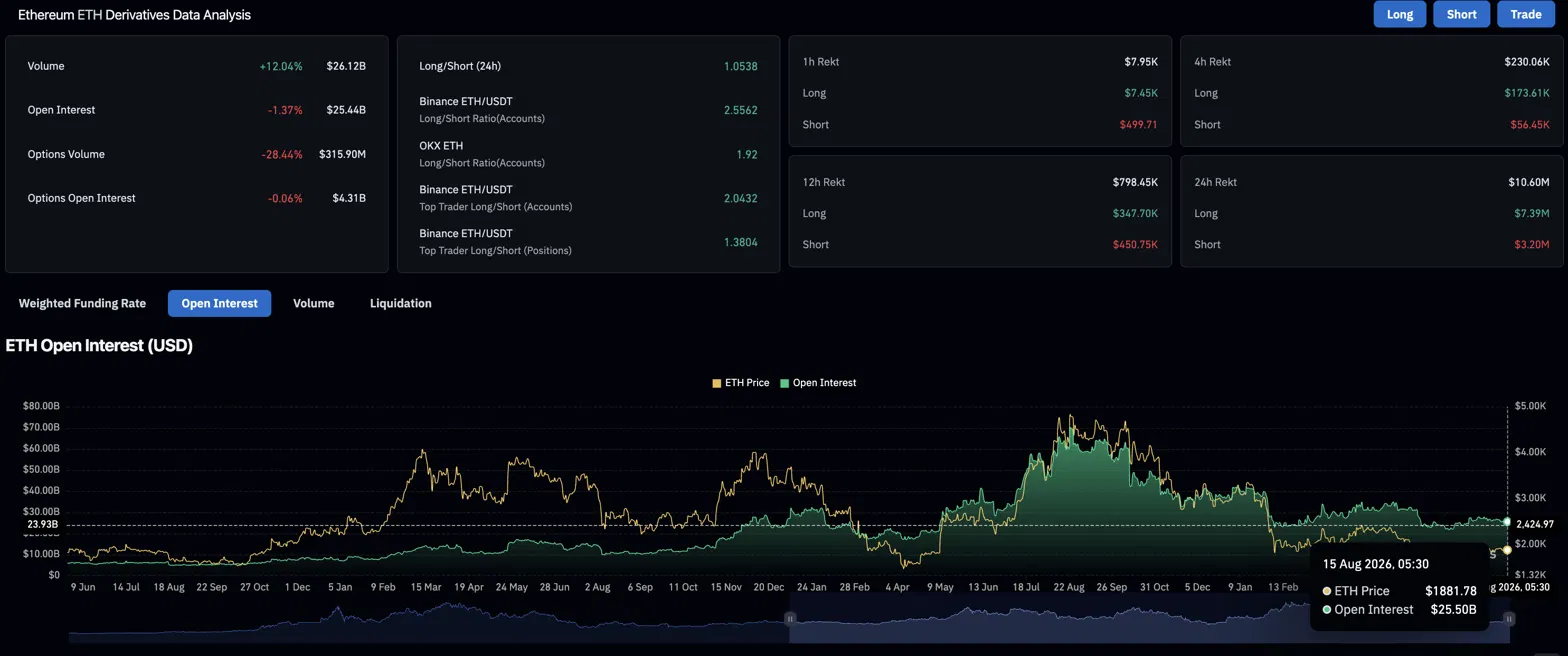
Moreover, derivatives volume rose 12.04% to $26.12B while open interest fell 1.37% to $25.44B, meaning more trading activity happened, but fewer positions are being held overall.
That points to traders closing out rather than committing to a new direction, which makes sense given the triangle has not broken yet.
Liquidations over 24 hours totaled $10.60M, with longs absorbing $7.39M against $3.20M for shorts, meaning buyers are taking slightly more pain than sellers in the current standoff.
(adsbygoogle = window.adsbygoogle || []).push({});The symmetrical triangle resolves upward as ETH closes above the Parabolic SAR at $1,919.69 and the 100-day EMA at $1,918.38 on a daily basis. Record-low sell exhaustion means there is little overhead selling pressure to absorb, and the five-week ETF inflow base provides enough institutional demand to support the breakout. Price pushes through the $1,960 triangle upper boundary toward the $2,000 round number as the first meaningful target of the week.
The triangle resolves downward as the Parabolic SAR and 100-day EMA continue to cap recovery attempts. The ETF outflow week extends into a second, with price breaking the 50-day EMA at $1,864 and the 0.382 Fibonacci at $1,837 before finding the triangle lower boundary near $1,800 as the last meaningful support.