
Behind Gold's October Crash: Oil Prices Taking Control of Pricing, Goldman Sachs Reveals $19.5 Billion Speculative Capital Retreat

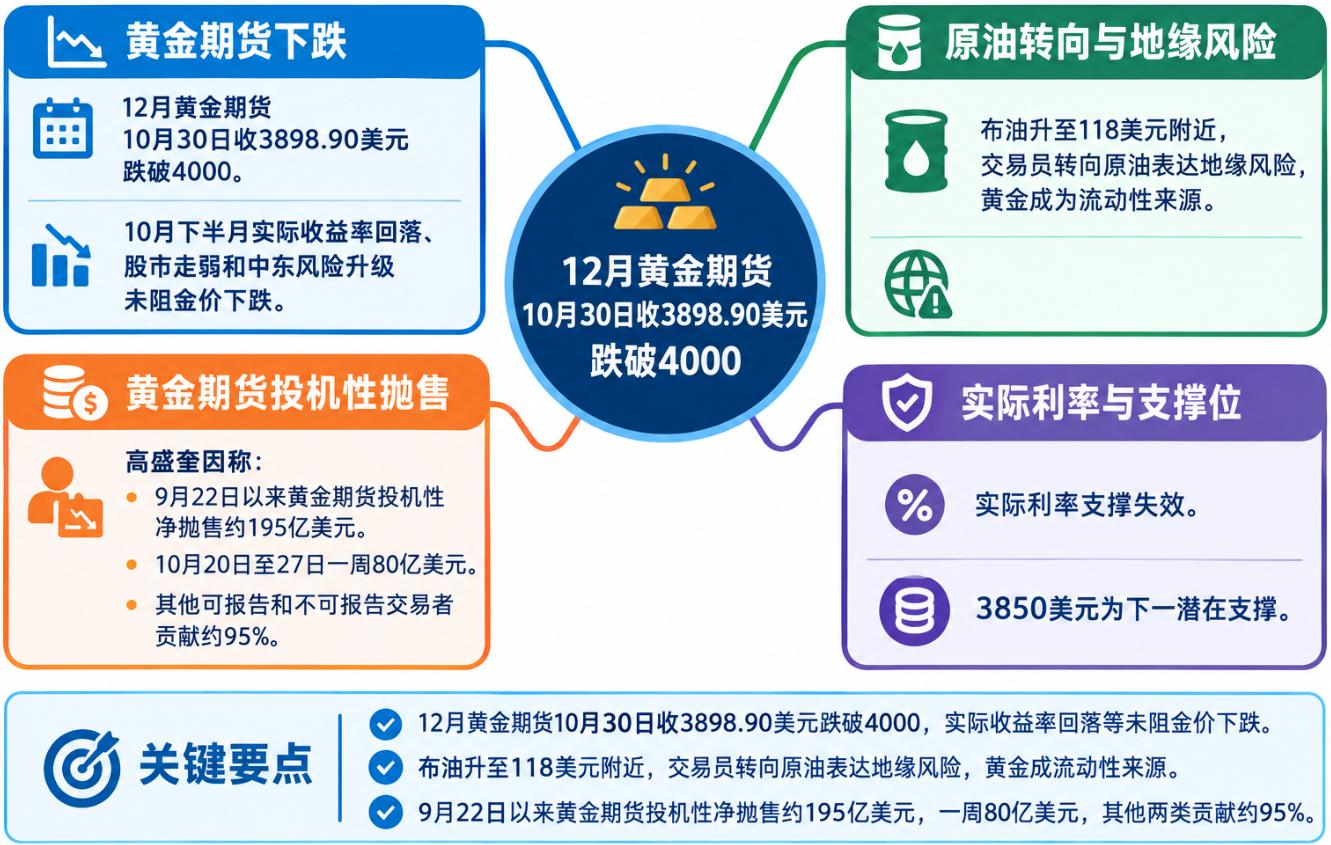
Gold futures for December delivery closed at $3,898.90 on October 30, falling below the $4,000 mark. In the second half of October, gold's performance significantly diverged from traditional safe haven assets: despite the decline in US real yields, weaker stock markets, and escalating risks of renewed Middle East military conflict, none of these factors managed to prevent gold prices from dropping.
Behind this wave of selloffs, the market’s trading logic is undergoing a transformation. Brent crude futures rose to around $118, and the geopolitical risk premium is spreading along the oil futures curve toward longer-dated contracts. More and more traders are choosing to directly express war risk through oil instead of buying gold.
Meanwhile, Robert Quinn, an analyst at Goldman Sachs, analyzed US Commodity Futures Trading Commission (CFTC) position data and found that since September 22, there has been approximately $19.5 billion in cumulative speculative net selling of gold futures. In just the week from October 20 to 27, the scale of selling reached $8 billion.
What deserves more attention is the sources of these funds. In the most recent round of selloffs, Other Reportables and Non-Reportables contributed about 95%, while total long positions in other categories remain at historical highs.
Oil Replaces Gold as a Major Vehicle for Geopolitical Risk Trades
The unusual performance of gold in October requires an explanation starting from the oil market.
Brent crude futures for January delivery once hovered around $118, reflecting that the market has priced in higher risk premiums for a renewed escalation of Middle East military conflict. The noteworthy aspect is not just the oil price itself, but also the trend of this premium spreading to longer-term contracts.
When war risk premiums extend from near-term settlement contracts to longer-dated contracts, this means that the market worries not just about brief supply interruptions but also about the possibilities of ongoing supply disturbances, military escalation, and prolonged logistics uncertainties.
This change is also affecting how investors express geopolitical risks. Traders increasingly prefer to buy oil directly, while using gold as a source of liquidity. They may sell gold to fund other positions, meet margin requirements, or reduce overall portfolio risk.
Despite the fact that crude oil shipments in the Persian Gulf have basically returned to normal, the oil market still prices in a considerable Middle East military conflict risk premium.
Accompanying this, the inverse relationship between Brent and precious metals has become increasingly apparent. In the past, geopolitical tension typically drove capital flows toward gold and silver; but in the second half of October, while oil prices rose, precious metals remained under continuous pressure.
Market performance shows that if this recent relationship continues, every 10% rise in Brent could correspond to a roughly 4% fall in gold. This is merely an observation of recent market behavior, not a mechanically applicable trading rule. Especially as oil prices have already priced in a significant proportion of geopolitical risk premium, this correlation could quickly reverse with changes in underlying market conditions.
This also explains why gold has not displayed traditional safe-haven characteristics during this round of Middle East turmoil. Oil is gradually becoming the main vehicle for the market to gauge geopolitical risk, while gold, in some trades, has turned into a tool for financing and adjusting risk exposure.
However, oil prices can only explain part of the reason for gold’s decline. The real question that needs further clarification is which investors are the main sellers of gold in this wave.
$19.5 Billion Net Sold in Five Weeks—Non-Traditional Hedge Fund Capital is Main Driver
In his report "Gold Futures: Five Consecutive Weeks of Speculative Selling," Quinn analyzed CFTC trader position data as of October 27.
Data shows that since September 22, gold futures have seen cumulative speculative net selling of about $19.5 billion. Of that, the one-week period from October 20 to 27 was particularly dramatic, with Managed Money, Other Reportables, and Non-Reportables collectively cutting about $8 billion in exposure.
Of this $8 billion, $5.2 billion resulted from closing existing positions, while the other $2.8 billion came from newly established short positions.
The distinction is crucial. The former means investors are exiting existing positions, while the latter indicates that some funds have actively turned bearish on gold, not simply taking profits after a price rise.
At a gold price of roughly $4,000 per ounce, $19.5 billion is equivalent to a notional exposure of about 150 tons of gold. But this is just the notional value in the futures market and does not mean that 150 tons of physical gold were actually sold in the market.
Position changes show that speculative positions in gold accumulated quickly during the September price rally, and then sharply reversed as gold gave back its gains.
What’s truly surprising is the composition of the sellers.
The market typically focuses first on hedge funds, Commodity Trading Advisors (CTAs), and leveraged macro trading accounts. These participants are often seen as the major selling force when market momentum reverses and prices drop sharply.
But Quinn’s data indicates that in the most recent week, Other Reportables and Non-Reportables contributed about 95% of speculative selling. Among these, unwinding long positions by other categories contributed about $4 billion.
The Other Reportables classification is particularly noteworthy. It includes some large-scale participants who cannot be easily categorized as traditional managed funds, swap dealers, or commercial hedgers.
Such participants may include proprietary trading firms, family offices, and other institutional accounts. However, the CFTC does not disclose the specific identities of these participants in the classification data.
This means the selling pressure on the gold market is not solely coming from traditional hedge funds. Even if the most closely watched speculative accounts have sharply cut positions, other investors may still hold substantial long positions.
Another data point from Quinn’s report further reveals this risk.
During October, total long positions in other categories once exceeded 20% of total open interest in gold futures. As of October 27, this ratio had fallen to about 18%, but remained significantly above the 11%-12% seen earlier this year.
In other words, the market has already undergone large-scale position unwinding, but potential excess position pressure has not fully disappeared. Investors need to pay attention not only to whether hedge funds have finished unwinding, but also to whether slower-moving funds will continue to exit.
In addition, the CFTC position report only reflects positions as of Tuesday, October 27. Since then, gold prices have continued to fall. Thus, the current data reveals the selling mode prior to the breach of key price levels, but cannot accurately reflect how many positions may have been closed in the final trading days. Subsequent position reports will provide a more complete picture.
Real Yields Fail to Support Gold as Downside Protection Cost Rises Sharply
The behavior of traditional macro pricing factors also shows that this round of gold correction cannot be explained solely by real yields or dollar trends.
Quinn points out that during the week of October 20 to 27, the US 10-year real yield dropped by 11 basis points, but gold still fell about 1.6%. In the same period, Brent rose 4.1% and the dollar strengthened 0.6%.
A drop in real yields usually benefits gold, which does not generate interest income, while a stronger dollar and higher oil prices can create pressure. But in this week, the support from lower real yields failed to offset shocks from other factors.
From October 27 to 30, gold fell another 4.3%, Brent crude continued up 3.7%, while the dollar and real yields both retreated from previous levels.
This combination suggests that market trading is increasingly influenced by position adjustments and geopolitical liquidity needs, with the traditional real yield pricing relationship at least temporarily losing dominance.
Sovereign liquidity management may also be a potential channel for risk transmission. Rising energy prices could increase the US dollar funding needs for oil-importing countries, and geopolitical instability may alter liquidity preferences among national reserve managers.
During the Iran War in March 2026, Turkey sold gold and used gold-backed swap transactions to obtain liquidity in order to defend the Turkish lira. This shows that gold held as a reserve asset may also be used in certain circumstances to obtain liquidity.
However, CFTC position data cannot identify whether sovereign institutions participated in futures selling, and Quinn’s analysis does not prove that central banks are selling physical gold. This is just a possible risk transmission mechanism, not a confirmed source of selling.
It is also necessary to distinguish between structural official sector buying and leveraged fund futures unwinding. Central banks may continue to increase physical gold holdings for long-term reserve allocation, while speculative investors may still sell futures on a large scale, thereby suppressing market quotes. The investment motives and trading cycles of the two capital types are not the same.
The options market provides another perspective: investors are paying higher costs for downside protection on gold.
Quinn notes that both three-month implied volatility for gold and the standardized 25-delta put-call skew have risen. The latter has reached around the 85th percentile of its volatility range over the past year.
This reflects deepening investor concern over gold’s downside risk. Previously, when prices were rising, capital was willing to pay a premium for upside participation; as the market weakens, investors are increasingly focused on guarding against further declines.
However, options pricing itself cannot distinguish whether the relevant trades are for buying downside protection or for speculative bearish bets on gold.
Goldman Sachs’ commodities desk’s description of last Friday’s trading activity also shows that investors still lack a distinct directional consensus.
The desk noted that some long-side investors have become worried after gold’s decline, while potential buyers are assessing whether current prices represent a buying opportunity, but the level of actual client participation in trades remains limited.
Most of the selling was completed via electronic trading platforms, with a significant uptick in trading at the Chicago Mercantile Exchange (CME) and a marked increase in volumes for the gold ETF—SPDR Gold Trust (GLD).
Goldman Sachs’ commodities desk now sees $3,850 as the next potential support area, while admitting that the break below $3,950 was unexpected.
Thus, $3,850 is a price level to watch, but does not mean this correction must end there. Judging whether the selloff is nearing its end will require monitoring whether gold futures selling slows, downward protection costs in the options market ease, and whether the inverse relationship between oil and gold begins to weaken.
Disclaimer: The content of this article solely reflects the author's opinion and does not represent the platform in any capacity. This article is not intended to serve as a reference for making investment decisions.
You may also like
ECB Picks Digital Euro Network Providers as Pilot Infrastructure Takes Shape

US Stock IPO Analysis | AOJE.US Growth Blueprint Spanning Both Consumer and Industrial Sectors, Driven by Three Key Logic Factors
As both revenue and profit decline, what kind of growth narrative will Aojie Co., Ltd. use to convince Nasdaq investors to buy in?

Crypto prices
More


