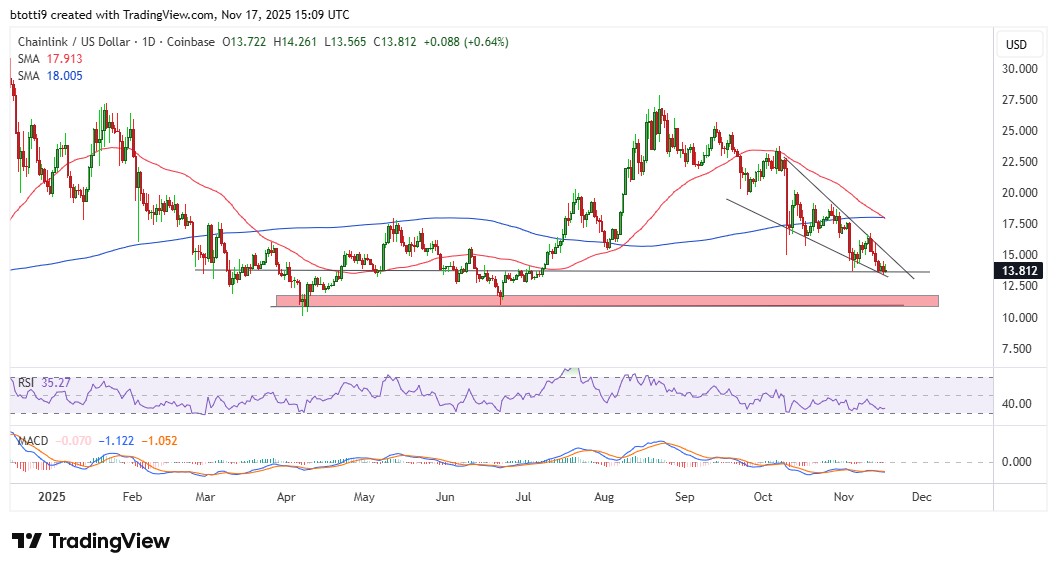
- Chainlink price broke below $14 on Monday and traded to lows of $13.45 amid a spike in volume.
- LINK shows weakness as a bearish setup forms on the daily chart.
- Bears could target $10.97 if weakness intensifies near $13.
Chainlink trades in a downward trend that mirrors the renewed selling pressure that has pushed Bitcoin below $95,000 and top altcoins into the red.
LINK, the native token of Chainlink, hovered near the psychologically important $13 mark as bulls struggled.
Notably, this comes after the token failed to sustain momentum after bulls hit highs above $27.80 in August.
Lately, a decline below $20 amid a 21% nosedive on October 10,2025 has seen LINK erase most of bulls managed since the July 2025 uptick. Price fell below $14 on Friday.
Could the broader caution cascading across the altcoin market allow for further price deterioration?
Chainlink extends decline to near $13
As of writing, Chainlink price has lost 13% over the past week. While bulls are near the $14, the token touched intraday lows of $13.45 on Monday.
One key observation is that Chainlink’s trading volume has remained elevated during the downturn.
This suggests conviction among sellers, who have pushed prices lower amid a symmetrical triangle pattern formation.
Accompanied by a sharp spike in volume, up 59% in 24 hours to over $837 million, LINK’s breakdowns mirror what typically happens amid fresh downside volatility.
In fact, as can be seen in the chart below, the altcoin’s daily price chart signals a potential death cross pattern.
What’s the Chainlink price outlook?
The technical outlook has key indicators flashing bearish signals, with the 50-day simple moving average (SMA) set to cross below the 200-day simple moving average.
Death crosses are lagging indicators, which means that while not entirely predictive in itself before confirming, their appearance has historically marked the beginning of an extended bearish phase.
 Chainlink daily chart by TradingView
For Chainlink, indications of downward pressure go beyond the death cross.
On the daily chart, the Relative Strength Index (RSI) has fallen below the neutral 50 level and is approaching oversold territory. RSI currently sits near 36/
Also strengthening downward pressure is the Moving Average Convergence Divergence (MACD). Currently, the histogram is negative, and the MACD line below the signal line points to strong bearish momentum.
From a price action perspective, the next major support cluster lies in the $11.77-$10.97 area.
Per the daily chart, this zone has previously acted as a strong demand in April and June 2025.
However, if Chainlink can defend the $13 psychological threshold, near-term projections could see bulls target an immediate major resistance mark near $15.55.
The level coincides with the previous golden cross pattern that saw bulls break out above $20 and hit highs of $27 in August.
Bullish, but a daily close below $13 means bears could have a path to a revisit of the multi-year support near $8.50.
