Bitget App
Trade smarter
Buy cryptoMarketsTradeFuturesEarnSquareMore
Starknet (STRK) Surges Higher — What Does This Emerging Pattern Signal Next?

Starknet (STRK) Surges Higher — What Does This Emerging Pattern Signal Next?

CoinsProbeCoinsProbe2025/11/19 08:27
By:Nilesh Hembade

Date: Wed, Nov 19, 2025 | 05:55 AM GMT

The broader crypto market is dealing with fresh downside volatility as Ethereum (ETH) slips back under $3,000 after touching a 24-hour high of $3,167. Even in this shaky environment, a few altcoins are standing out by maintaining strong upward momentum — and Starknet (STRK) is one of the brightest performers today.

STRK has jumped an impressive 16% in the past 24 hours, extending its monthly rally to a massive 85%. This surge comes at a time when most of the market is pulling back, giving STRK extra attention from traders looking for strength during uncertainty. But despite the ongoing rally, the lower-timeframe chart is hinting at a pattern that could shape the token’s next major move.

Starknet (STRK) Surges Higher — What Does This Emerging Pattern Signal Next? image 0 
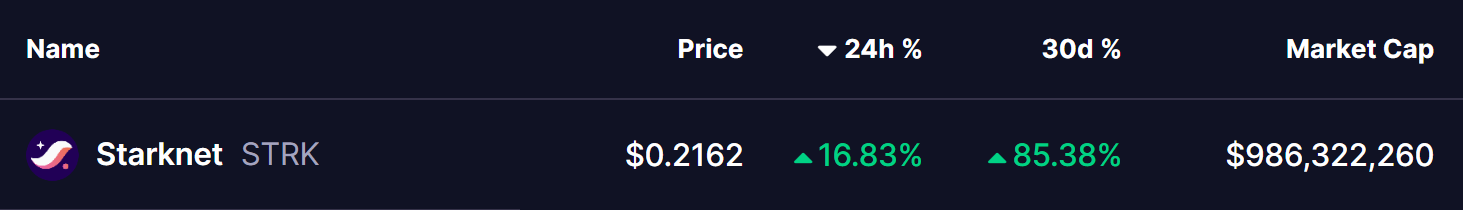
Source: Coinmarketcap

Bearish Butterfly in Play?

On the 4H timeframe, STRK appears to be developing a potential bearish butterfly harmonic pattern.

This type of formation is known for pushing the price higher during the CD leg before reaching its completion zone, called the Potential Reversal Zone (PRZ). The early structure of this pattern began with Point X forming near $0.244976, followed by a sharp decline into Point A at $0.169772. After that drop, STRK bounced strongly to reach Point B at today’s high of $0.22.

Starknet (STRK) Surges Higher — What Does This Emerging Pattern Signal Next? image 1 Starknet (STRK) 4H Chart/Coinsprobe (Source: Tradingview)

The price has since slipped slightly below that level, currently hovering around $0.2164, which suggests that the BC leg may now be forming.

What’s Next for STRK?

If the bearish butterfly pattern continues to take shape, STRK could retest the 0.886 Fibonacci area, where a potential C point may form near $0.176800. This would represent a roughly 17% decline from current levels. While a drop may sound negative at first, this zone is where harmonic patterns often generate strong bullish reactions, setting the stage for a powerful CD-leg rally.

For now, the pattern is still in its early phase and cannot be confirmed until price action develops around the expected C-point area. Traders watching STRK should pay close attention to how the token behaves as it moves toward deeper support levels. If buyers step in aggressively at the projected zone, it could signal the beginning of the next strong upside wave.

Despite the unconfirmed structure, STRK’s overall trend remains strong. With its ongoing breakout momentum, a controlled pullback may actually strengthen the next leg of the rally — especially if the broader market stabilizes.

0

Disclaimer: The content of this article solely reflects the author's opinion and does not represent the platform in any capacity. This article is not intended to serve as a reference for making investment decisions.

PoolX: Earn new token airdrops
Lock your assets and earn 10%+ APR
Lock now!

You may also like

The PENGU USDT Sell Alert: Is This a Temporary Market Dip or the Start of a Downtrend?

- PENGU USDT's Q3 2025 depegging (28.5% drop) exposed liquidity risks from opaque collateral and high-yield incentives, triggering cascading DeFi liquidations. - Investor flight to transparent stablecoins like USDC/USDG accelerated post-GENIUS Act/MiCA, with PENGU's governance opacity making it a pariah in 2025's regulatory climate. - November 2025 data shows algorithmic stablecoins face structural crisis as redemption rates spike, with PENGU failing to reclaim key support levels despite temporary October

Bitget-RWA2025/11/24 22:04
The PENGU USDT Sell Alert: Is This a Temporary Market Dip or the Start of a Downtrend?

XRP News Today: Clearer Regulations and Institutional ETFs Drive XRP to 8% Surge

- XRP surged 8.25% as Franklin Templeton and Grayscale launched XRP ETFs on NYSE Arca, marking institutional adoption progress. - Grayscale's GXRP offered 0% fees initially, while Franklin's XRPZ charged 0.19% with waived fees on first $5B assets. - SEC approval followed Ripple's 2025 settlement, clarifying XRP's non-security status and boosting institutional confidence. - XRP's price hit $2.11 with $423M ETF inflows, driven by low fees and cross-border payment utility in crypto infrastructure.

Bitget-RWA2025/11/24 21:46
XRP News Today: Clearer Regulations and Institutional ETFs Drive XRP to 8% Surge

Dogecoin Latest Updates: Meme Coin Sector Falters Amid SHIB's Support Level Examination Raising Wider Worries

- Shiba Inu (SHIB) fell 13% to $0.0000081 on Nov 21, 2025, testing critical support levels amid bearish market pressure. - Technical indicators show RSI at 34 and MACD bearish crossover, signaling sustained selling pressure but potential rebound if $0.0000081 holds. - Broader meme coin market weakens as Dogecoin (DOGE) and Pepe (PEPE) also face sharp corrections, reflecting risk-off investor sentiment. - Analysts highlight SHIB's low price and community engagement as potential recovery catalysts, though fu

Bitget-RWA2025/11/24 21:46

Bitcoin News Today: Bitcoin Drops Sharply: Is This a Temporary Correction or the Start of a Crash as Options and ETFs Drive a $75K Retest?

- Bitcoin fell below $84,000 as put options dominance and ETF outflows amplified volatility amid macroeconomic uncertainty. - $903M Bitcoin ETF outflows and $262M Ethereum ETF outflows reflect waning risk appetite ahead of Fed's December meeting. - Options market pressures at $75,000 strike price and Fed policy ambiguity heighten risks of prolonged price declines. - Altcoins like Ethereum and XRP declined 4-5% as risk-off sentiment spreads across crypto markets. - Analysts warn $75,000 support level could

Bitget-RWA2025/11/24 21:46
Bitcoin News Today: Bitcoin Drops Sharply: Is This a Temporary Correction or the Start of a Crash as Options and ETFs Drive a $75K Retest?