Polkadot bulls test “home” range as DOT revisits long-term $2 accumulation zone

Polkadot trades near $2 inside a long-term accumulation “home” range flagged since 2022, where Egrag Crypto sees structural support but no confirmed bottom yet.
- DOT has returned to a price band an analyst labels a long-term accumulation zone, after a sharp intraday drop and subsequent stabilization around $2.
- Egrag Crypto frames the area as a structural floor using Wyckoff accumulation logic, liquidity wicks, and Polkadot’s multi-chain role, while still allowing for deeper downside.
- Inclusion in a Bitwise index and potential cycle-bottom dynamics support a long-term accumulation thesis, but traders are watching whether buyers defend this “home” range again.
Polkadot ( DOT ) traded near $2 on Friday as the cryptocurrency returned to a price level chart analyst Egrag Crypto has identified as a long-term accumulation zone since June 2022.
The token experienced a sharp intraday decline before consolidating around the price area, according to market data. Egrag Crypto, in a recent post, stated the current range represents what the analyst has termed the asset’s “home” range.
The analyst disclosed accumulating the token at higher levels and adding positions more recently at lower prices. Egrag Crypto characterized the range as a structural floor based on historical price behavior and Polkadot’s position in multi-chain infrastructure, according to the post.
Polkadot trending on Bitwise
The analyst cited Polkadot’s inclusion in the Bitwise index fund and its multi-blockchain capabilities as factors supporting a long-term investment case. Egrag Crypto noted that an October price wick may represent either a black swan event or a cyclical retest of lower liquidity zones consistent with four-year market cycles.
Chart data showed the token briefly rising above short-term resistance before reversing and dropping to lower levels where it stabilized. Trading volume increased during the early rally before shifting as sellers entered the market during the decline, according to the data .
Egrag Crypto’s analysis references Wyckoff accumulation structures, cycle timing, and Polkadot’s historical pattern of revisiting deep liquidity levels before recovering. The analyst’s framework poses questions including which Wyckoff schematic applies to current price structure, whether the current level represents a bottom, and potential upside targets if a cycle bottom confirms.
The analyst maintains a long-term accumulation approach while acknowledging uncertainty about whether the token has formed a final bottom or could decline further, according to the post.
Market participants are now monitoring whether buyers view the current price region as a long-term opportunity or whether market conditions will push the cryptocurrency lower into its accumulation band.
Disclaimer: The content of this article solely reflects the author's opinion and does not represent the platform in any capacity. This article is not intended to serve as a reference for making investment decisions.
You may also like
Bitget Releases Major Upgrades to GetAgent With Smarter Responses and Free Access for All Users
Will Fed Uncertainty Cap XRP’s Upside in 2026?
They already knew the TGA Game of the Year in advance, earning tens of thousands of dollars.
Violating history, yet persisting.

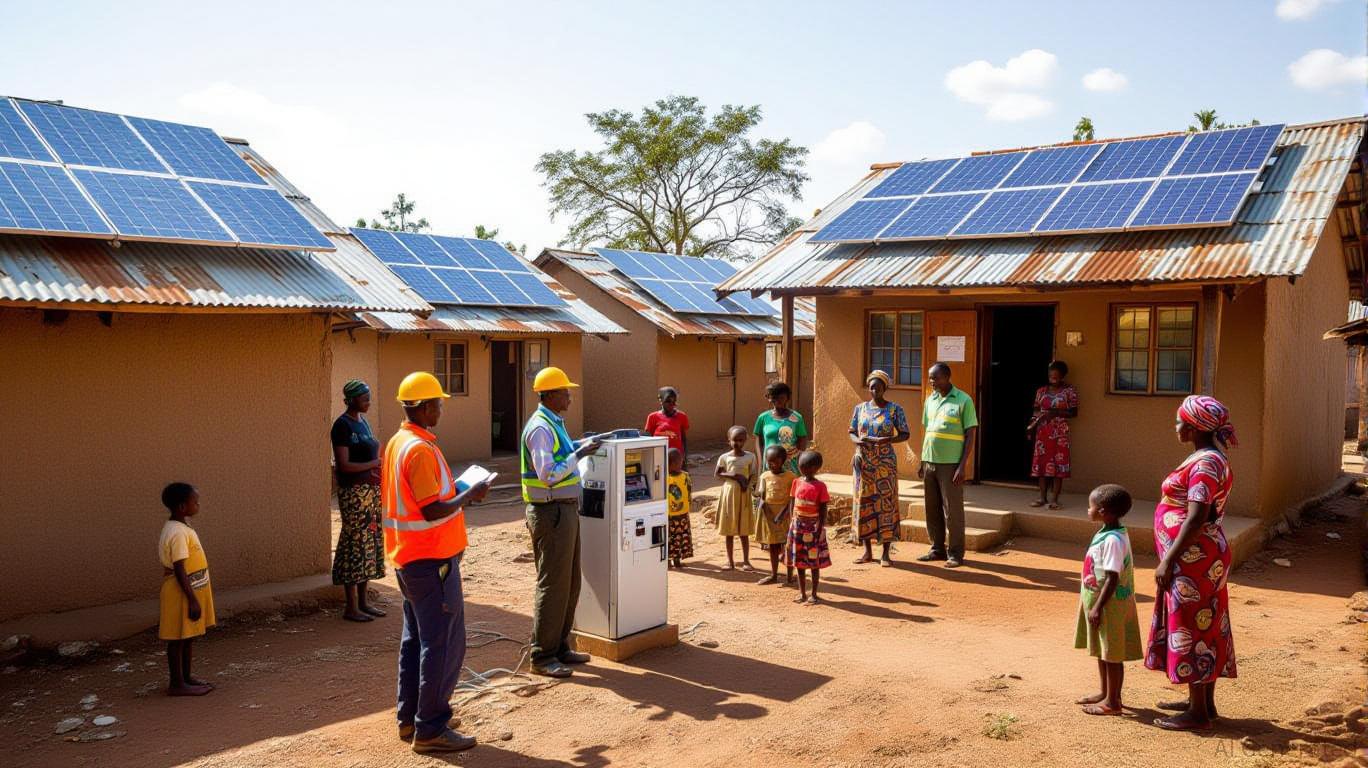
The Convergence of Social Justice and Renewable Energy Implementation in Developing Economies
- IEA data shows emerging markets need $45B/year by 2030 to achieve universal clean energy access, with Africa and Asia facing the greatest demand. - Renewable projects in low-income regions demonstrate nonlinear ESG impacts, with solar microgrids directly reducing energy poverty for 600M+ Africans. - PIDG's $27M guarantees mobilized $270M in African renewables, proving blended finance models can de-risk investments while creating 200-300MW capacity. - Kenya's M-KOPA and Indonesia's JETP showcase scalable