
Bitcoin IFP Hints At Potential Turnaround: What It Means

By:Newsbtc
Bitget offers one-stop trading for cryptocurrencies, stocks, and gold. Trade now!
A welcome pack worth 6200 USDT for new users! Sign up now!
On-chain data shows the Bitcoin Inter-exchange Flow Pulse (IFP) has shown early signs of a turnaround recently, suggesting tokens have started moving into derivatives platforms.
Bitcoin IFP Is Turning Around, But Not Yet Inside Bull Market Zone
As pointed out by an analyst in a CryptoQuant Quicktake post, the Bitcoin IFP has seemingly hit a bottom recently. The “IFP” is an indicator that measures the amount of BTC that’s flowing between spot and derivatives exchanges. When the value of this metric is rising, it means the investors are making a higher amount of transactions from spot to derivatives platforms. Such a trend suggests speculative interest in the market is going up.

On the other hand, the indicator witnessing a decline implies traders may be pulling back on risk as they are sending a lower number of tokens to derivatives markets.
var rnd = window.rnd || Math.floor(Math.random()*10e6); var pid607465 = window.pid607465 || rnd; var plc607465 = window.plc607465 || 0; var abkw = window.abkw || ''; var absrc = 'https://servedbyadbutler.com/adserve/;ID=172179;size=0x0;setID=607465;type=js;sw='+screen.width+';sh='+screen.height+';spr='+window.devicePixelRatio+';kw='+abkw+';pid='+pid607465+';place='+(plc607465++)+';rnd='+rnd+';click=CLICK_MACRO_PLACEHOLDER'; document.write('
');
if (!window.AdButler){(function(){var s = document.createElement("script"); s.async = true; s.type = "text/javascript";s.src = "https://servedbyadbutler.com/app.js";var n = document.getElementsByTagName("script")[0]; n.parentNode.insertBefore(s, n);}());}
var AdButler = AdButler || {}; AdButler.ads = AdButler.ads || []; var abkw = window.abkw || ""; var plc366606 = window.plc366606 || 0; (function(){ var divs = document.querySelectorAll(".plc366606:not([id])"); var div = divs[divs.length-1]; div.id = "placement_366606_"+plc366606; AdButler.ads.push({handler: function(opt){ AdButler.register(172179, 366606, [728,90], "placement_366606_"+opt.place, opt); }, opt: { place: plc366606++, keywords: abkw, domain: "servedbyadbutler.com", click:"CLICK_MACRO_PLACEHOLDER" }}); })();
Now, here is a chart that shows the trend in the Bitcoin IFP, as well as its 90-day moving average (MA), over the past decade:
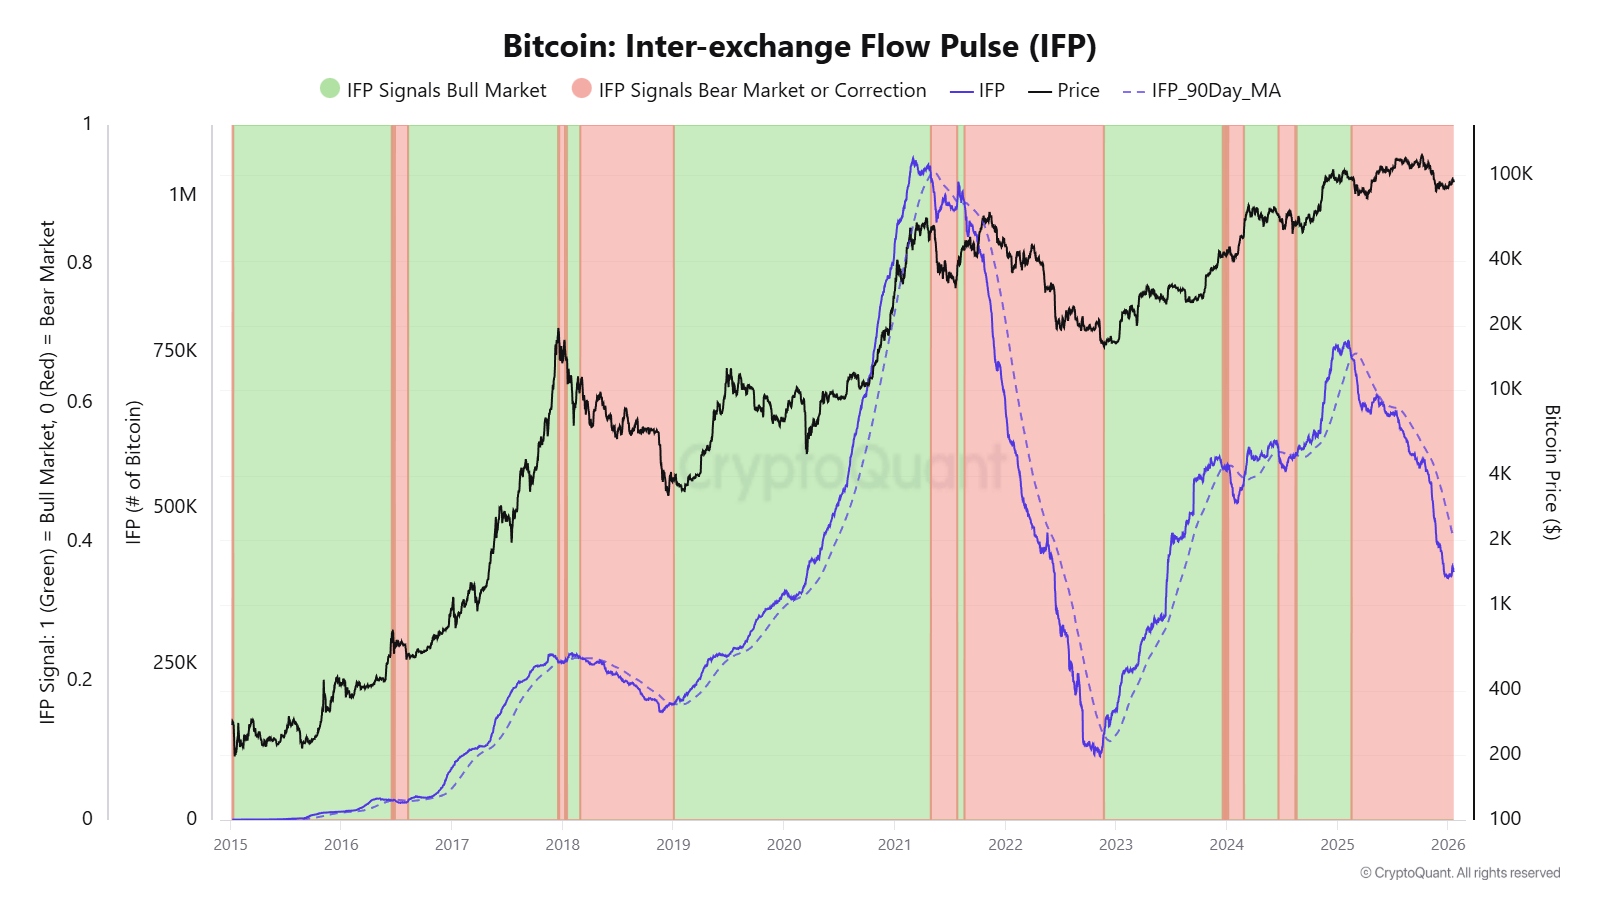 The value of the metric seems to have been following a decline for months | Source:
CryptoQuant
The value of the metric seems to have been following a decline for months | Source:
CryptoQuant
As displayed in the above graph, the Bitcoin IFP hit a high in the first quarter of 2025 and reversed course, suggesting speculative activity began to decline. Soon after the start of this downtrend, the metric slipped under its 90-day MA. CryptoQuant considers such a crossover to be a bearish one, labeling periods with the indicator below the 90-day MA to correspond to bear markets or corrections.
Interestingly, while the cryptocurrency went on to see rejuvenation of bullish momentum and set a new all-time high (ATH) later in 2025, the market environment leaned bearish from the perspective of the IFP, with the metric’s value holding a steady downward trajectory.
var rnd = window.rnd || Math.floor(Math.random()*10e6); var pid607472 = window.pid607472 || rnd; var plc607472 = window.plc607472 || 0; var abkw = window.abkw || ''; var absrc = 'https://servedbyadbutler.com/adserve/;ID=172179;size=0x0;setID=607472;type=js;sw='+screen.width+';sh='+screen.height+';spr='+window.devicePixelRatio+';kw='+abkw+';pid='+pid607472+';place='+(plc607472++)+';rnd='+rnd+';click=CLICK_MACRO_PLACEHOLDER'; document.write('
');
if (!window.AdButler){(function(){var s = document.createElement("script"); s.async = true; s.type = "text/javascript";s.src = "https://servedbyadbutler.com/app.js";var n = document.getElementsByTagName("script")[0]; n.parentNode.insertBefore(s, n);}());}
var AdButler = AdButler || {}; AdButler.ads = AdButler.ads || []; var abkw = window.abkw || ""; var plc452518 = window.plc452518 || 0; (function(){ var divs = document.querySelectorAll(".plc452518:not([id])"); var div = divs[divs.length-1]; div.id = "placement_452518_"+plc452518; AdButler.ads.push({handler: function(opt){ AdButler.register(172179, 452518, [728,90], "placement_452518_"+opt.place, opt); }, opt: { place: plc452518++, keywords: abkw, domain: "servedbyadbutler.com", click:"CLICK_MACRO_PLACEHOLDER" }}); })();
Recently, however, the early signs of a shift may have finally emerged, as the IFP has shown a turnaround. This increase in derivatives exchange flows has come for Bitcoin as its price has gone through a recovery surge. For now, though, the indicator is still floating at a notable distance under its 90-day MA.
In the past, a break beyond this line has usually led to bullish price action for the cryptocurrency, so such a crossover could potentially be a positive sign this time as well. Whether speculative activity related to the asset will rise enough to overcome this threshold only remains to be seen.

Bitcoin Short-Term Holders Take Profits: 41,800 BTC Sent To Exchanges
Speaking of speculation, the Bitcoin Open Interest, a measure of the amount of BTC positions open on all derivatives exchanges, has surged 3.2% alongside BTC’s pullback in the past day, as CryptoQuant community analyst Maartunn has highlighted in an X post.
var rnd = window.rnd || Math.floor(Math.random()*10e6); var pid607473 = window.pid607473 || rnd; var plc607473 = window.plc607473 || 0; var abkw = window.abkw || ''; var absrc = 'https://servedbyadbutler.com/adserve/;ID=172179;size=0x0;setID=607473;type=js;sw='+screen.width+';sh='+screen.height+';spr='+window.devicePixelRatio+';kw='+abkw+';pid='+pid607473+';place='+(plc607473++)+';rnd='+rnd+';click=CLICK_MACRO_PLACEHOLDER'; document.write('
');
if (!window.AdButler){(function(){var s = document.createElement("script"); s.async = true; s.type = "text/javascript";s.src = 'https://servedbyadbutler.com/app.js';var n = document.getElementsByTagName("script")[0]; n.parentNode.insertBefore(s, n);}());}
var AdButler = AdButler || {}; AdButler.ads = AdButler.ads || []; var abkw = window.abkw || ''; var plc452519 = window.plc452519 || 0; (function(){ var divs = document.querySelectorAll(".plc452519:not([id])"); var div = divs[divs.length-1]; div.id = "placement_452519_"+plc452519; AdButler.ads.push({handler: function(opt){ AdButler.register(172179, 452519, [728,90], 'placement_452519_'+opt.place, opt); }, opt: { place: plc452519++, keywords: abkw, domain: 'servedbyadbutler.com', click:'CLICK_MACRO_PLACEHOLDER' }}); })();
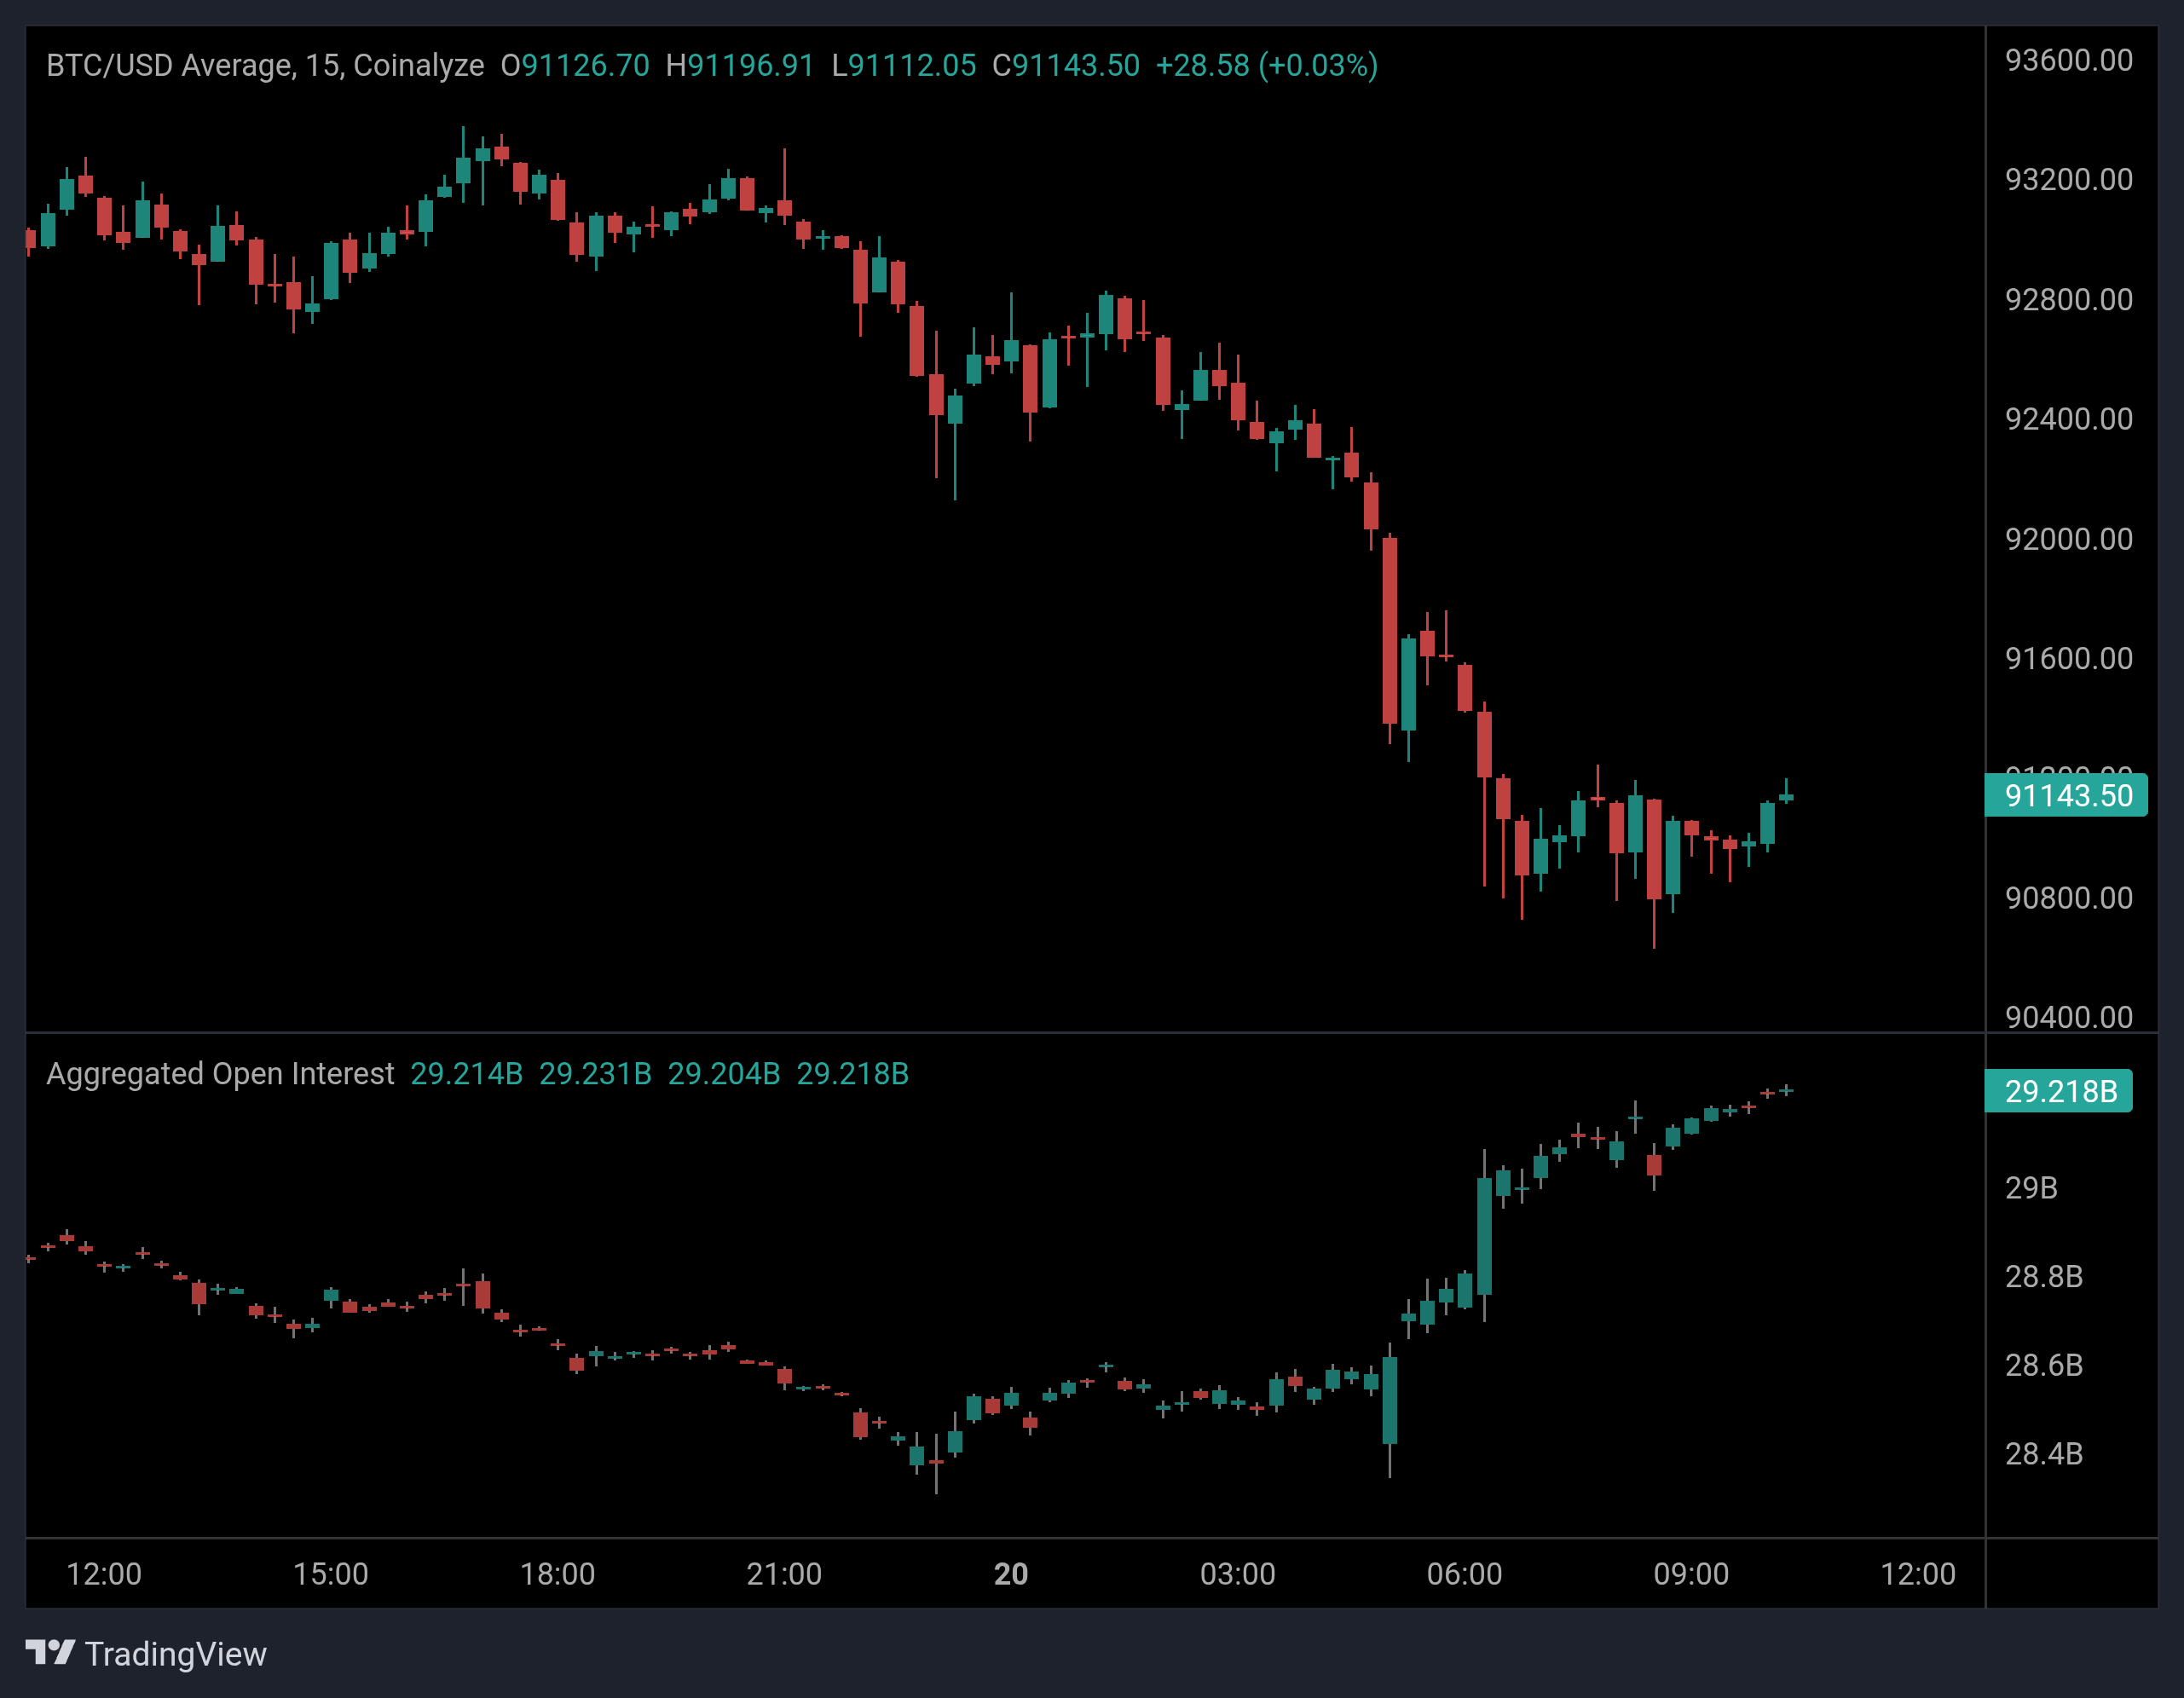 The recent trend in the BTC Open Interest | Source:
@JA_Maartun on X
The recent trend in the BTC Open Interest | Source:
@JA_Maartun on X
BTC Price
Bitcoin has gone through a plunge over the last couple of days that has taken its price from $95,000 to $91,200.
 The price of the coin seems to have opened the week with bearish action | Source:
BTCUSDT on TradingView
The price of the coin seems to have opened the week with bearish action | Source:
BTCUSDT on TradingView
0
0
Disclaimer: The content of this article solely reflects the author's opinion and does not represent the platform in any capacity. This article is not intended to serve as a reference for making investment decisions.
Understand the market, then trade.
Bitget offers one-stop trading for cryptocurrencies, stocks, and gold.
Trade now!
You may also like
Ethereum matches $2,350 price from April 2021 after five years
Cointurk•2026/04/16 23:18
Final Support Test for Altcoins: $700B Line in Focus — 5 Coins Positioned for a Massive Rebound
Cryptonewsland•2026/04/16 23:18
Bitcoin Rally Stalls As 60,000 BTC From STHs Hits Exchanges
Newsbtc•2026/04/16 23:15

Alibaba - Don't miss the parabolic rally!
TradingView•2026/04/16 23:09
Trending news
MoreCrypto prices
MoreBitcoin
BTC
$74,998.37
+0.34%
Ethereum
ETH
$2,344.95
-0.56%
Tether USDt
USDT
$1
+0.01%
XRP
XRP
$1.45
+4.33%
BNB
BNB
$634.32
+1.81%
USDC
USDC
$0.9996
-0.01%
Solana
SOL
$88.98
+4.97%
TRON
TRX
$0.3273
-0.03%
Dogecoin
DOGE
$0.09895
+4.31%
Hyperliquid
HYPE
$43.92
-1.47%
How to buy BTC
Bitget lists BTC – Buy or sell BTC quickly on Bitget!
Trade now
Become a trader now?A welcome pack worth 6200 USDT for new users!
Sign up now