Key Takeaways
- Bitcoin ended January on a weak note after falling from $97,000 to near $75,722, setting a fresh yearly low.
- U.S. Bitcoin spot ETFs recorded a net outflow of $1.61 billion in January, adding pressure to BTC price action.
- Despite monthly outflows, cumulative spot ETF inflows remain strong at over $55 billion, signaling long-term institutional interest.
- A bullish fractal comparison suggests Bitcoin may be in a healthy pullback phase, similar to past continuation setups.
- Holding the $74,494 support remains critical for BTC’s bullish structure heading into February.
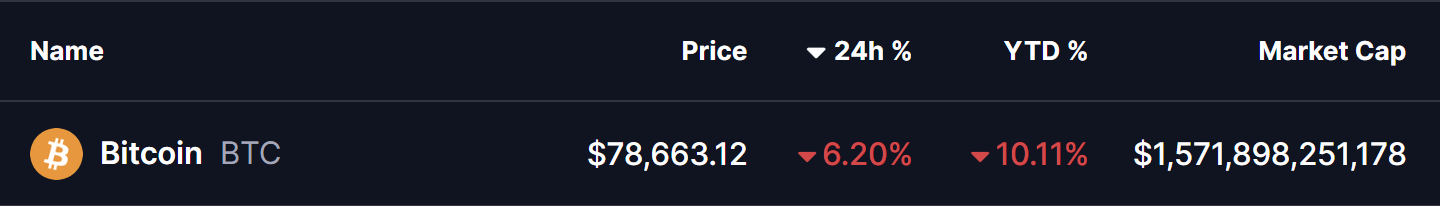
Bitcoin ($BTC), the largest cryptocurrency by market capitalization, failed to hold its early January recovery momentum as sellers took control toward the month’s close. After printing a monthly high near $97,000, BTC reversed sharply and ended January 31, 2026, with a deep wick toward $75,722, marking a 6.20% decline in the last 24 hours and roughly a 10% drop year-to-date, while also setting a fresh yearly low.
The sudden downside move rattled market sentiment and triggered heavy forced selling across the crypto market. In the last 24 hours alone, total crypto liquidations surged to nearly $2.58 billion, highlighting how overcrowded bullish positioning had become.
 Source: Coinmarketcap
Bitcoin Spot ETF slumps in January
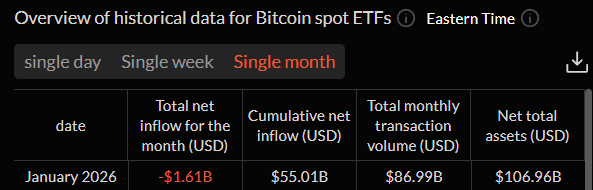
According to the latest data from SoSoValue, U.S. Bitcoin spot ETFs recorded a net outflow of approximately $1.61 billion in January 2026, marking one of the weakest monthly performances since approval.
Despite the outflows, cumulative net inflows still stand strong near $55.01 billion, with total net assets around $106.96 billion. However, the January data clearly shows that institutional demand cooled significantly during the month, adding pressure to BTC’s price action and accelerating the correction.
 Source: Sosovalue
Historically, sharp ETF outflow months often coincide with local fear phases, rather than long-term trend reversals — especially when broader market structure remains intact.
Key bullish fractal to watch out
Looking at the latest fractal comparison chart shared by crypto analyst Benjamin, Bitcoin’s current structure appears to mirror previous consolidation phases seen in major risk assets like Google (GOOG) and NVIDIA (NVDA) before their continuation rallies.
On the weekly timeframe, BTC is still respecting its broader uptrend while pulling back toward a critical horizontal demand zone near $74,494. In past cycles, similar corrective moves — following strong impulsive rallies — have acted as reset phases, allowing the market to absorb supply before pushing higher.
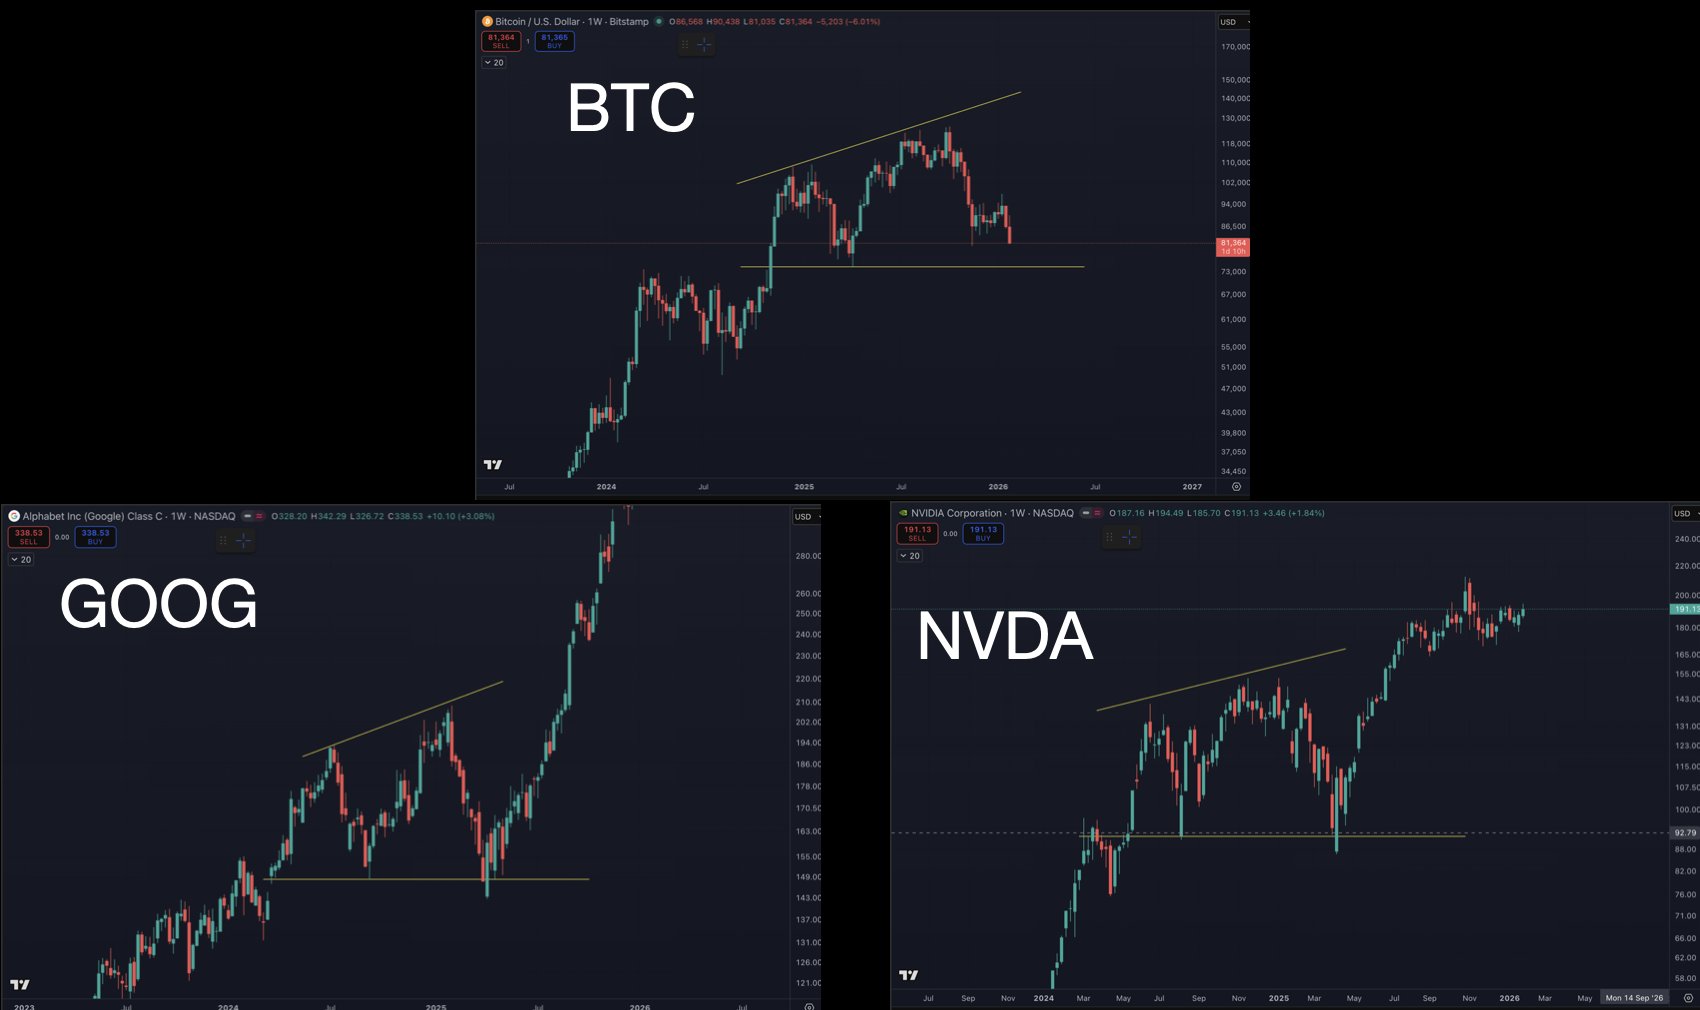 Bitcoin (BTC) Fractal Chart/Credits: @intocryptoverse (X)
This fractal suggests that the ongoing pullback could be a healthy consolidation, rather than the start of a prolonged bearish trend, as long as BTC continues to defend this key support region.
What February could hold for Bitcoin
If Bitcoin manages to hold above the $74,494 support, buyers may gradually step back in as selling pressure exhausts. A stabilization above this level could open the door for a renewed upside attempt toward the $85,000–$90,000 region in February.
However, a decisive breakdown below $74,494 would weaken the bullish fractal narrative and could expose BTC to deeper downside, potentially extending the correction.
For now, Bitcoin enters February at a crucial inflection point — shaken by ETF outflows and mass liquidations, yet still holding a structure that bulls will be watching very closely.
About Author: Nilesh Hembade is the Founder and Lead Author of Coinsprobe, with over 5 years of experience in the cryptocurrency and blockchain industry. Since launching Coinsprobe in 2023, he has been providing daily, research-driven insights through in-depth market analysis, on-chain data, and technical research.