


Dogecoin tests key resistance at the 50-day EMA as analysts signal potential upside momentum toward higher range levels.
Dogecoin ($DOGE) is trading at $0.09132, down 2.8% over the past 24 hours, with price action hovering near the lower end of its daily range between $0.09093 and $0.09736. The intraday chart shows an early push toward the $0.097 level before facing firm resistance, followed by a steady pattern of lower highs and lower lows that dragged the price back toward the $0.091 zone.
While $DOGE is slightly up 0.5% against Bitcoin, short-term momentum remains tilted to the downside unless bulls can reclaim the $0.094–$0.095 area. However, longer-term performance reflects continued pressure, with $DOGE down 8.9% weekly, 25.9% monthly, and 60.3% over the past year. This performance keeps the asset in a broader corrective phase as it tests the key psychological support around $0.090. What’s next for $DOGE?
Dogecoin Price Analysis
On the daily timeframe, Dogecoin is continuing a broader downtrend that has persisted since late 2025. Price remains firmly below both the 50-day EMA ($0.1116) and the 100-day EMA ($0.1296). The shorter-term average is positioned beneath the longer-term one, a clear bearish alignment that reinforces downward momentum.
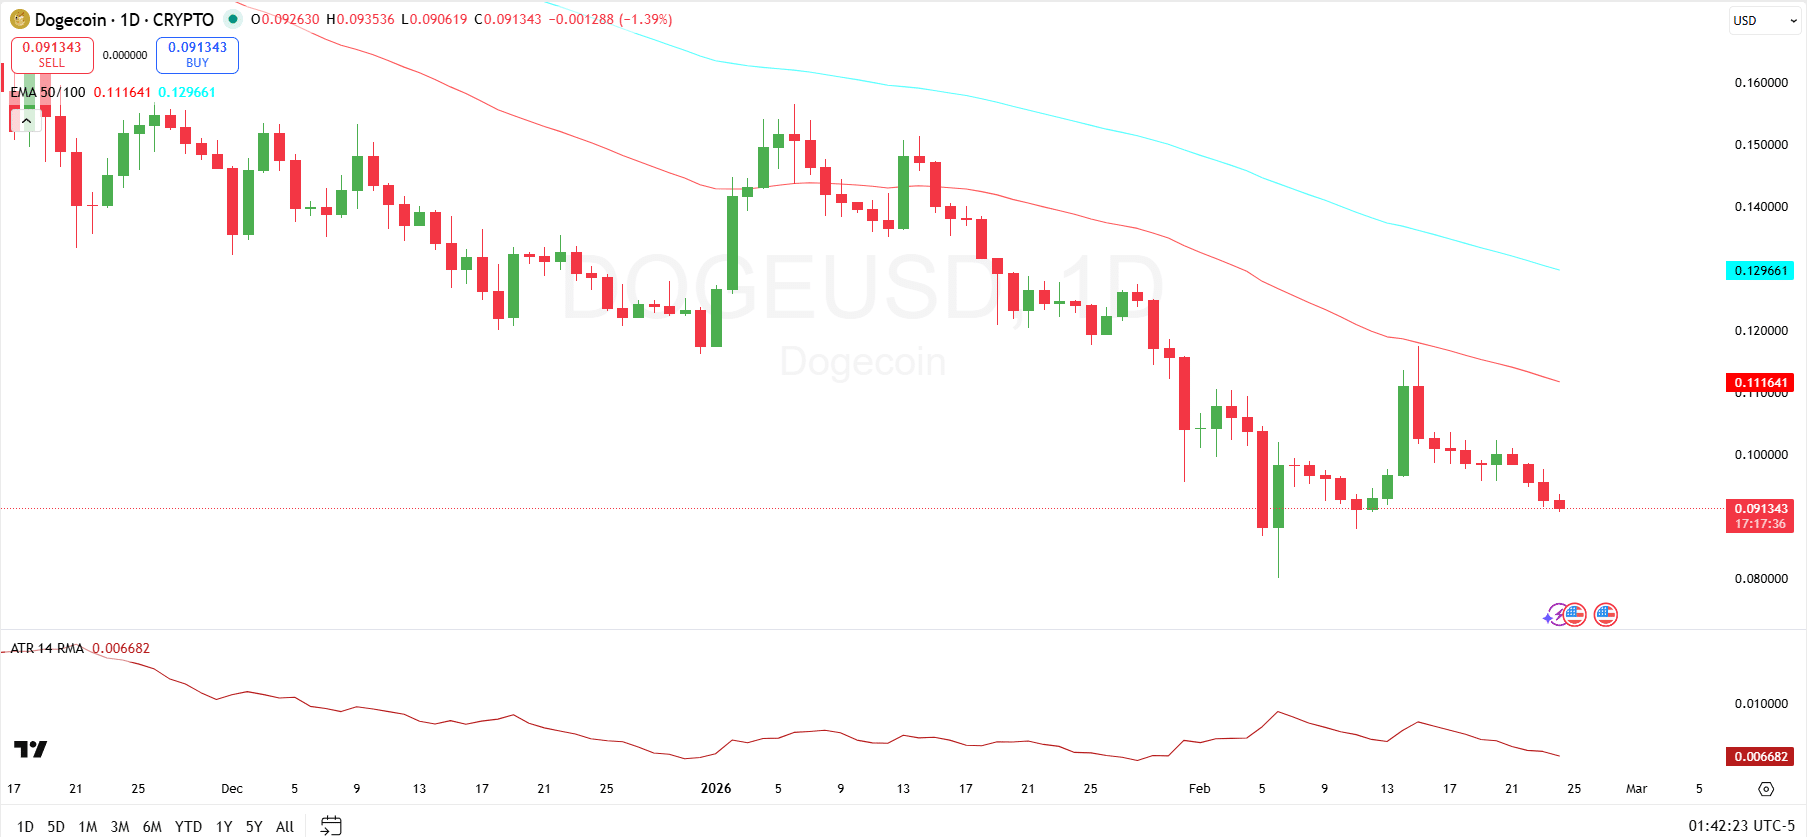
Recent candles show repeated rejection near the 50-day EMA, confirming it as dynamic resistance, while the latest moves drift back toward the $0.09 zone after a failed rebound attempt in mid-February. The structure continues to print lower highs and lower lows, signaling that sellers remain in control unless price can reclaim the $0.11–$0.13 region.
Meanwhile, the Average True Range has declined to approximately 0.0067, indicating falling volatility after the sharp selloff. This compression suggests the market is cooling and potentially preparing for a larger directional move.
However, with volatility easing during an established downtrend and no bullish EMA crossover in sight, the technical bias remains cautious. For sentiment to shift meaningfully, Dogecoin would need a decisive breakout above the 50-day EMA. Failure to breach that level would expose the $0.09 level to further downside pressure.
Dogecoin on Shorter Timeframes
Crypto analyst Trader Tardigrade notes that on the 4-hour chart, Dogecoin has rebounded from the RSI oversold zone after previously cooling off from overbought conditions. His chart shows that similar RSI resets in recent sessions have led to strong upward moves, including a rally toward the $0.115–$0.119 region.
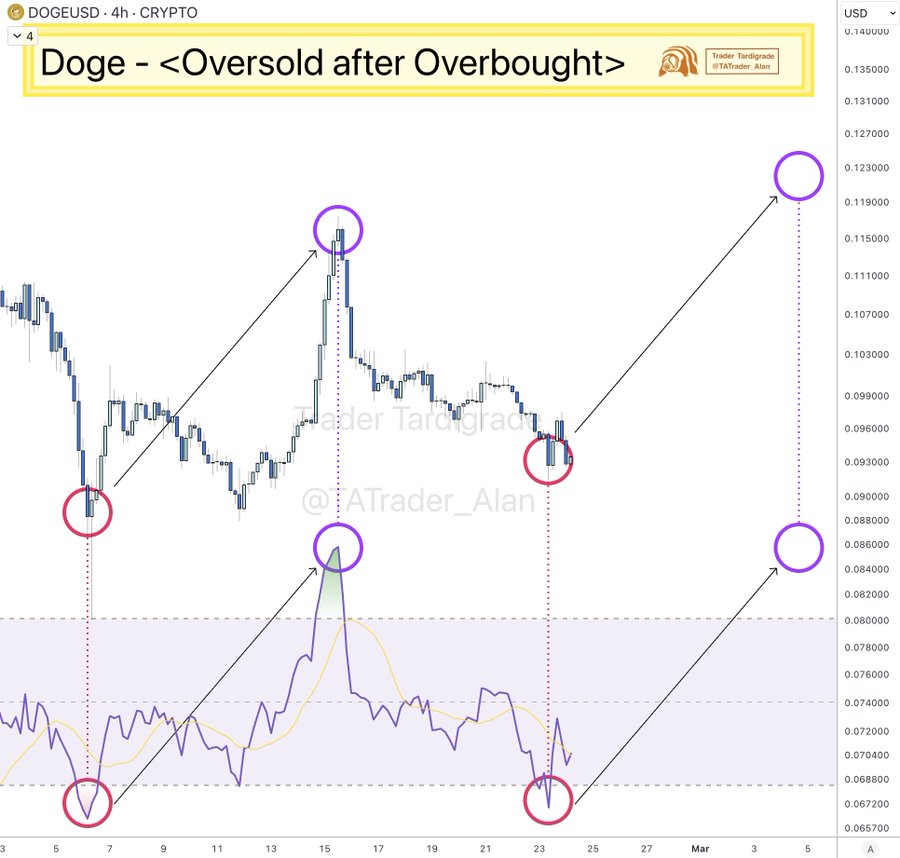
Based on this recurring pattern, the analyst projects a potential move back toward the upper boundary of the recent range, targeting a price above $0.119. To reach $0.119 from the current price of $0.09132, $DOGE would need to surge by about 30%.