beincrypto.com
The BitMine stock price jumped almost 14% on March 16 to above $23, pushing monthly gains to 16%. Pre-market on March 17 shows the stock above yesterday’s price, holding steady. Ethereum, which backs BitMine’s $11.5 billion treasury of 4.6 million tokens, is up roughly 13% monthly.
The follow-up surge from the BitMine stock price was not random. A momentum signal had been building for weeks, and buyers stepped in at a very specific moment.
One Tracking Metric Hit Its Weakest Point, Attracting Buyers
BitMine is an Ethereum treasury company. Its stock price is structurally tied to $ETH. But the two assets do not move in sync on a daily basis, and that mismatch is where the opportunity appeared.
Ethereum trades around the clock, seven days a week. When $ETH rallied around 7% from March 15 to 16 (weekend), BMNR was closed. It could not respond.
Want more insights like this? Sign up for Editor Harsh Notariya’s Daily Crypto Newsletter here.
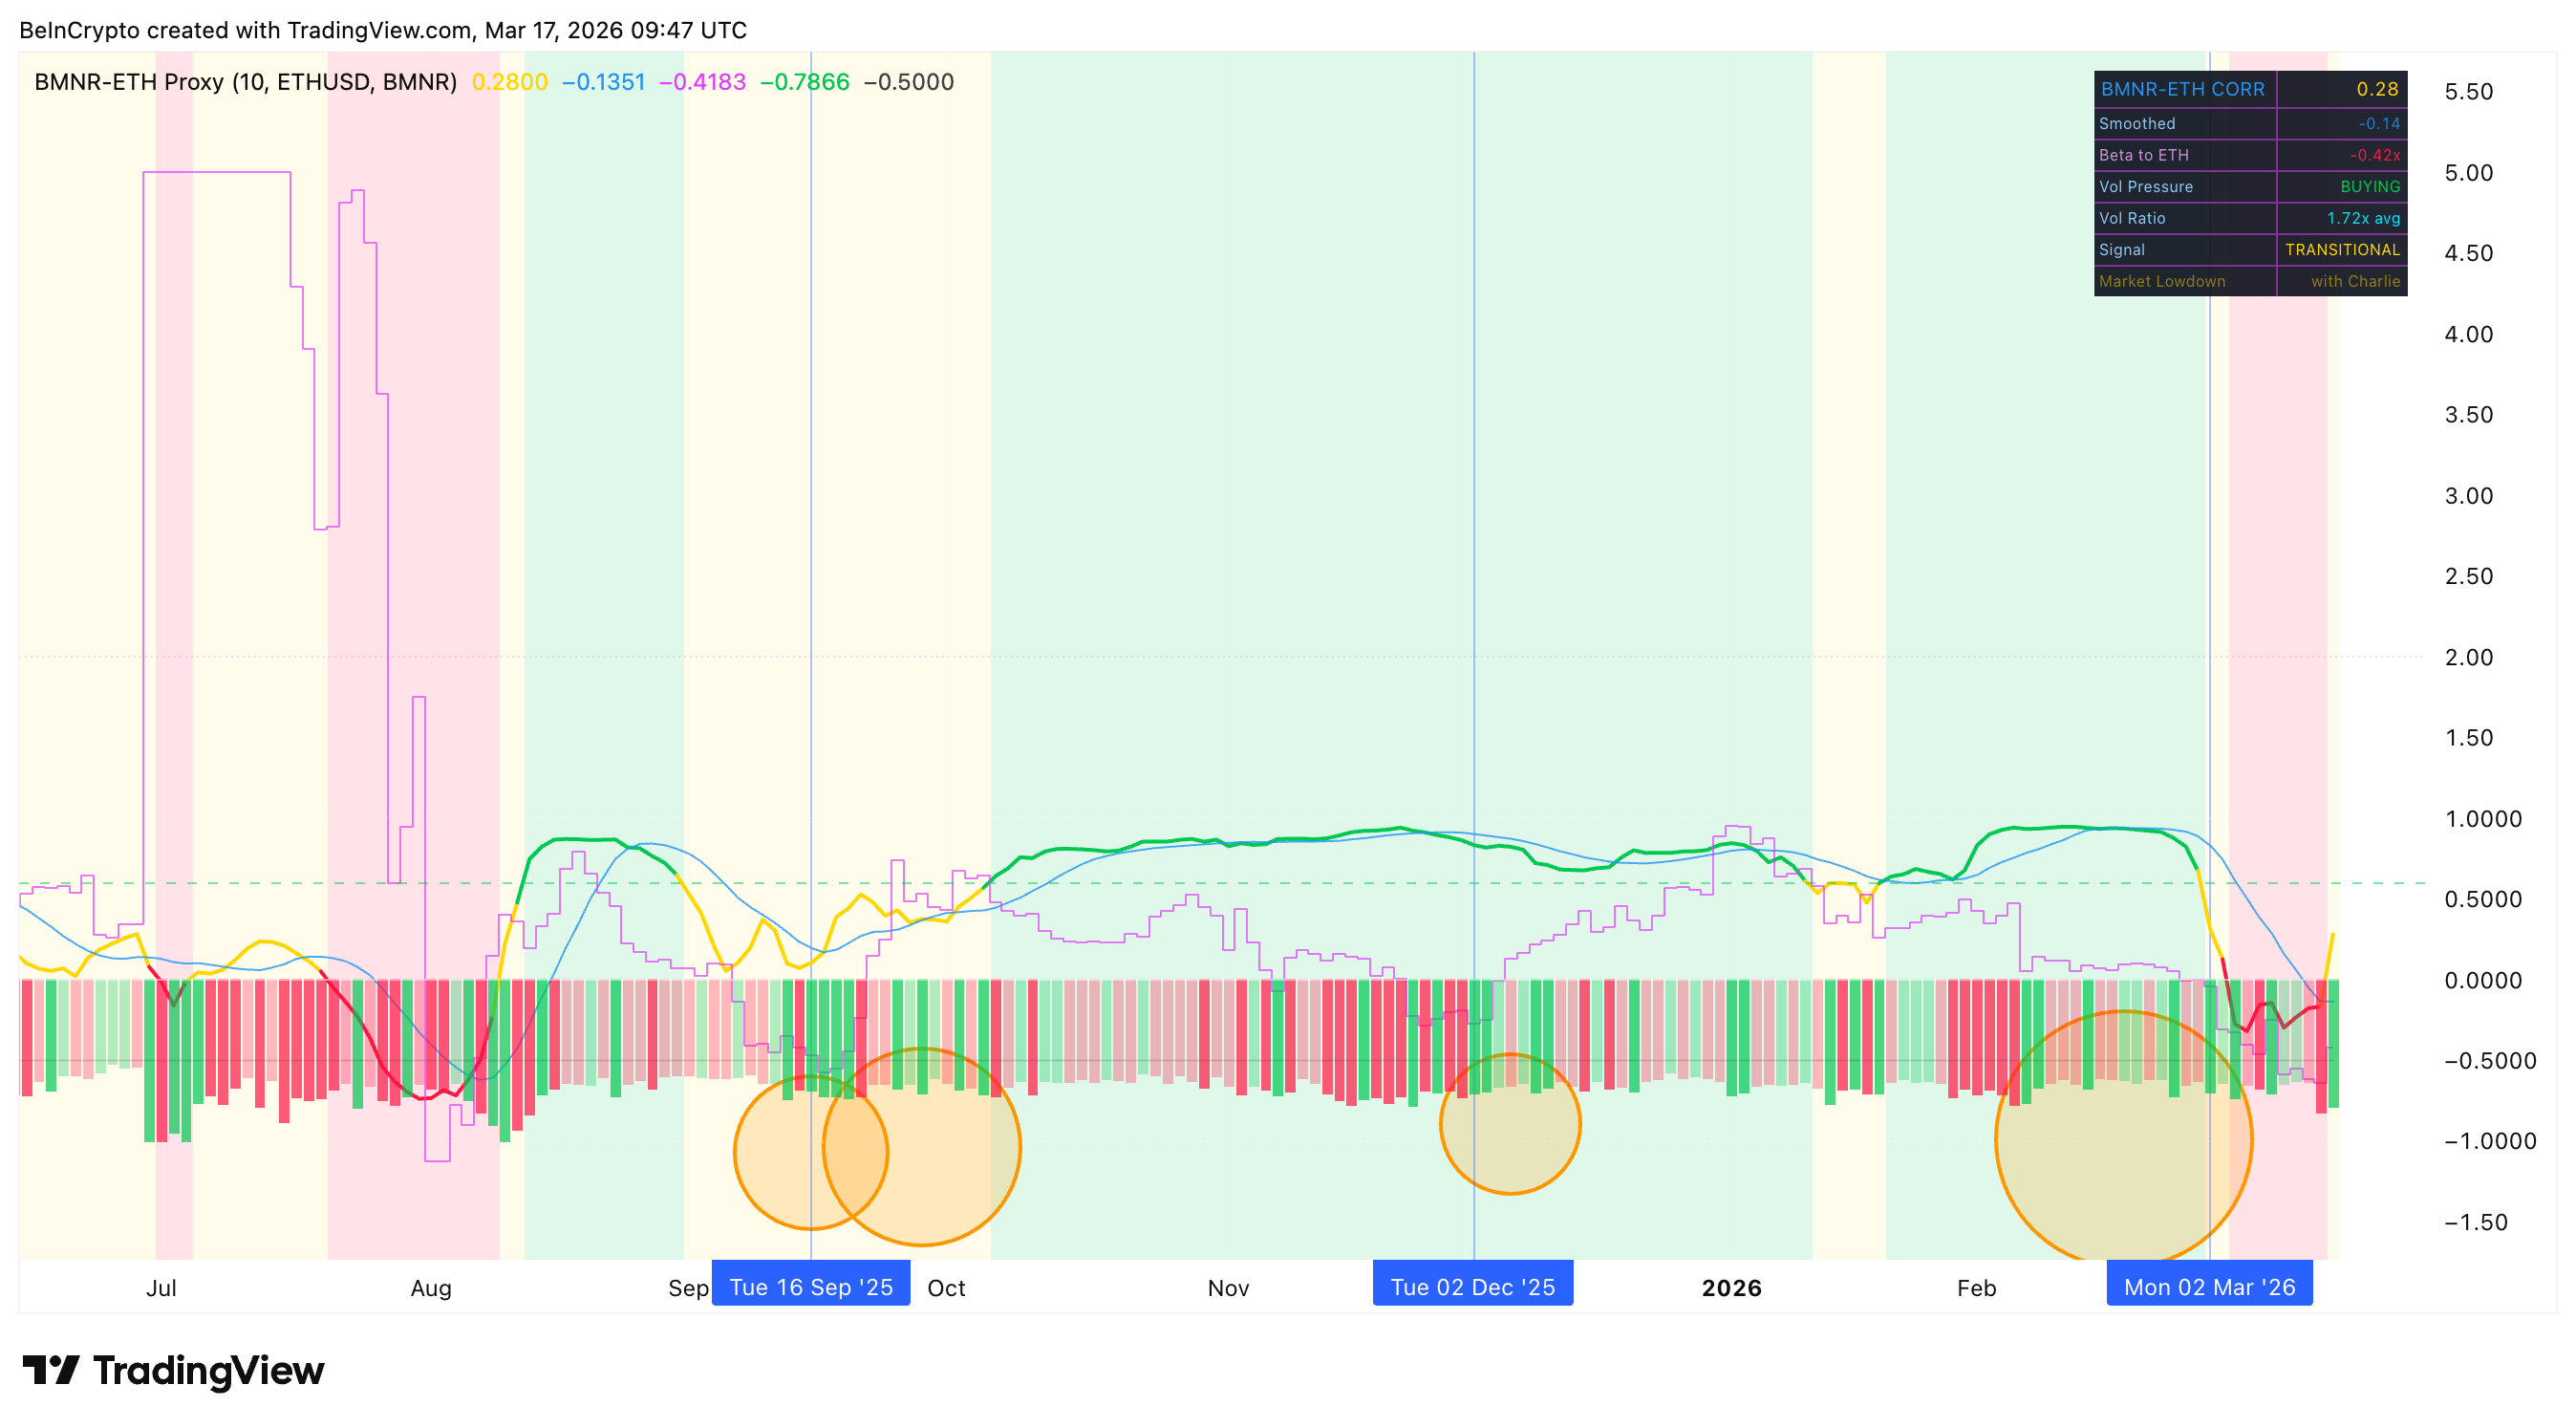
BeInCrypto’s proprietary BMNR-$ETH Proxy Tracker, which measures how closely BitMine follows Ethereum’s daily moves, registered this as a deepening dislocation.
Correlation dropped into negative territory, now sitting at 0.28. The beta, which measures how much BMNR amplifies each $ETH move, fell to -0.42x, its lowest reading in months.
But a negative beta here does not mean BitMine was moving against Ethereum. It means the stock simply could not keep up with an asset that never stops trading. The proxy tracker read that as divergence.
This is precisely where the buyers stepped in. The proxy tracker shows volume pressure flipped to BUYING at 1.72 times the 20-day average. When BMNR opened Monday, it played catch-up in a single 14% session, a pattern that has repeated at every major inflection, September 2025, December 2025, and February 2026.
 $ETH Proxy">
Each time, heavy buying appeared at a deep negative beta because the stock was trading at a discount to its underlying $ETH value. Institutional participants (big money) recognize this pattern to buy the discount, knowing the catch-up session (if $ETH is surging) delivers outsized returns as the gap closes. While buyers came in, the sellers were already losing the plot, as highlighted by the momentum indicator.
BitMine Stock Already Beat Sellers Twice
And the momentum was already shifting underneath. The Relative Strength Index or RSI, a momentum indicator, had been flashing a rare signal. Between December 31 and March 6, BMNR’s price made a lower low while RSI made a higher low, a standard bullish divergence.
Before that signal ran its course, a second divergence developed from the same December 31 anchor by March 12. The BitMine stock price retested the lows, but RSI printed an even higher reading, meaning sellers tested the floor twice and failed both times.
The divergence resolution and the proxy dislocation buying happened simultaneously, which improved the bullish sentiment.
Options Skew Adds to the Bullish Case, but the Price Structure Demands More
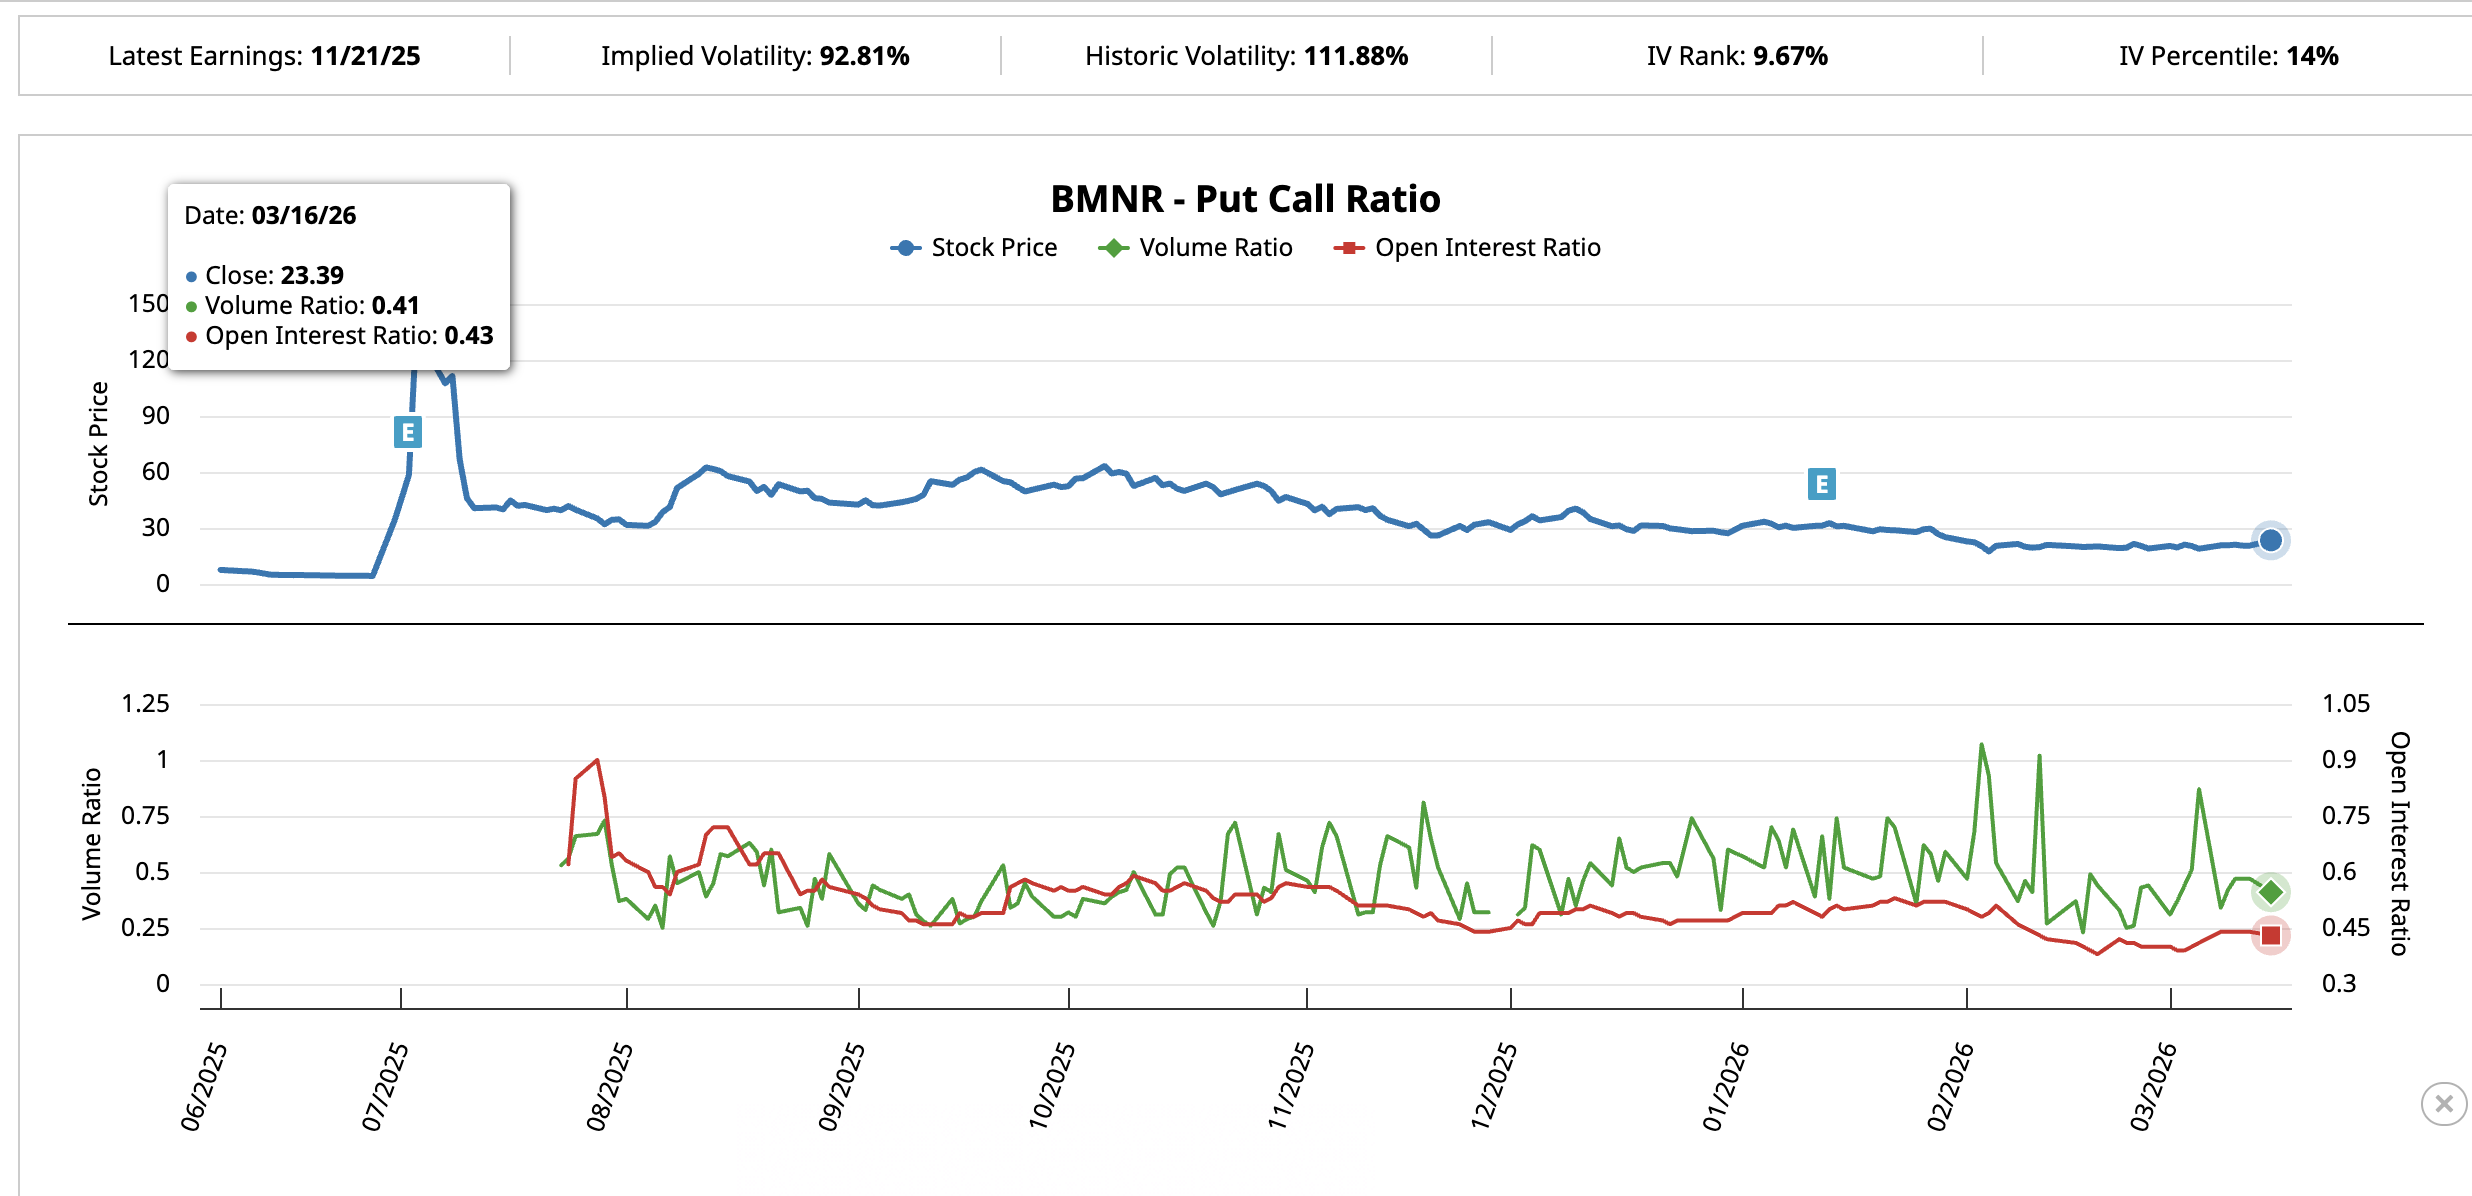
The bullish signal extends beyond momentum and proxy buying into the options market. The put-call ratio, which compares bearish bets against bullish ones, sits at 0.41 for volume and 0.43 for open interest. Both are below 0.5, meaning traders are heavily positioned for upside.
Three independent signals, the stacked RSI divergence, the proxy dislocation buying, and the call-heavy options positioning, rarely align at the same time. But the price structure still needs one clean confirmation.
BMNR dropped nearly 50% from above $34 to $17 between mid-January and February 5. Since then, it has been trading inside an ascending channel. While the channel slopes upward, it formed directly after a steep decline, making it a potential continuation pattern until the price breaks cleanly above the upper boundary.
Within the channel, BMNR reclaimed the 20-day EMA, a short-term trend line, at $21 and cleared the previous swing high of $22, which now acts as near-term support.
The decisive level is $24. The 50-day EMA at $24, a longer-term trend line that institutional participants watch, converges with the upper channel boundary at the same zone. A daily close above $24 would confirm the channel as a reversal rather than a bearish continuation. A close above $24 would also break the channel to the upside, unlocking bullishness. Until that close happens, the other signals look bullish, but the structure remains undecided.
BitMine Price Levels That Could Decide the Direction
BMNR closed above $23, pressing against the 1.0 Fibonacci level. The stock needs to clear this and then hold above $24, where the 50-day EMA and channel boundary converge, to confirm the breakout. Above $24, the 1.618 Fibonacci extension at $26 opens as the next target, followed by $31. Both are achievable if Ethereum sustains its recovery.
The proxy tracker supports the upside path. As this week’s trading data builds, the correlation between BMNR and $ETH should naturally improve from Monday’s catch-up and any continued co-movement during market hours. In prior instances when beta normalized from deeply negative back toward positive, BMNR outperformed Ethereum during the catch-up phase.
On the downside, failure to hold above $22, the previous swing high turned support, opens $21 and $20. A deeper slide toward the $18 base revisits the channel floor.
A break below $17, the year-to-date low, would invalidate the setup entirely. Everything above $24 accelerates the reversal. Everything below $22 keeps it in question. That is the range that matters this week.
The post BitMine Stock Price Jumps 16% as Big Money Buys the Gap $ETH Left Behind appeared first on BeInCrypto.