
Goldman Sachs: The interest rate market is overly "hawkish," and a rebound in the stock market doesn't require "solving the problem," only that the "shock has reached its limit."
The Iran War has impacted the pricing of global assets. Goldman Sachs believes that the market's pricing for monetary policy tightening is already significantly excessive, and for a rebound in stocks, it's not necessary to wait for a complete resolution of the crisis—it's enough for the market to see the limits of downside risk.
Dominic Wilson, Chief Cross-Asset Strategist at Goldman Sachs, stated in the latest report that since the outbreak of the Iran conflict, the market has primarily characterized this shock as a large-scale “hawkish policy shock” rather than a growth shock, leading to a significant rise in rate pricing for major economies. This pricing is evidently misjudged in magnitude, with a pronounced asymmetry on the downside risk for policy rate pricing.
At the same time, historical experience shows that stock market recoveries often do not require the crisis to be fully resolved; it only requires the market to confirm that downside risks have peaked. Taking the COVID-19 pandemic and tariff shocks as examples, stock markets bottomed out ahead of the peak pressure in the real economy. The current market pricing is already more pessimistic than the baseline scenario, but may still not fully reflect the probability of a U.S. recession and more adverse oil price scenarios.
On the cross-asset allocation level, once the tail-end downside risks narrow, assets such as U.S. and European stocks, U.S. Treasuries, and European currencies will be the first to benefit; in more adverse scenarios, European assets, the yen, and low-yield positions provide relatively better hedging value.
Market Direction Generally Correct, but “Hawkishness Magnitude” Exceeds Fundamentals
The market volatility triggered by the Iran War largely aligns with macroeconomic fundamentals—risk premiums have risen, cyclical assets have weakened, energy importers have come under pressure, and inflation and rate pricing have moved higher. However, there are two notable deviations between the market’s reaction and fundamental forecasts in terms of magnitude and structure.
First, and most importantly, the market's pricing of monetary policy tightening far exceeds what historical experience suggests is reasonable. Historically, the impact of oil price supply shocks on interest rates is ambiguous—growth drag and inflation pressure tend to offset each other. Yet this time, the market rapidly priced in rate hikes for several major economies, with sharp rises in front-end rates. Decomposition models of growth and policy shocks show that, so far, this crisis mainly reflects a large-scale hawkish policy shock, while the growth shock is comparatively mild.
The second deviation is that assets performing well before the war have actually declined more than fundamental forecasts would suggest, indicating that position unwinding has amplified the market move, affecting rates, some non-U.S. equities, currencies, and gold.
Rate Hike Pricing Overdone, Rates Have Downside “Asymmetry”
Current market pricing for the distribution of policy rates is misjudged, with significantly asymmetric downside risk. The market has already priced in rate hikes for virtually all major economies; out-of-the-money short-dated puts in the U.S., Eurozone, and U.K. suggest multiple hikes this year. Yet weighted average policy rate forecasts are below forward pricing, with the gap especially pronounced in the U.S. and Europe.
Historical experience shows that after an oil supply shock, policy rates tend to rise modestly over one to three months, but fall back as growth concerns rise within six to nine months. During the 1990 oil price shock, the market also priced in significant hawkish risk, but the Fed eventually made substantial rate cuts. This time, inflation concerns may prove overdone in the face of growth risks and rising unemployment, especially in the U.S., but the ECB is in a similar position.
Before oil prices themselves stabilize, yields may continue to face upward pressure and the market will find it hard to shake this dynamic in the short term.
Growth Pricing Below Baseline, but Tail Risks Not Priced In
Regarding growth pricing, Goldman Sachs believes that the market's implied pricing for U.S. growth over the next 12 months is about 1.3%, below its own baseline forecast, but may still not fully reflect more adverse oil price scenarios.
Growth pricing remains vulnerable. If more adverse oil price scenarios occur, the market probably has not fully priced in this tail risk. In addition, the tightening of global financial conditions itself—driven by rising rates—is already sufficient to warrant a meaningful downgrade in growth; if this continues or worsens, the actual growth shock may exceed the current assumption.
Current pricing is already notably pessimistic, but may still not fully reflect a 30% probability of U.S. recession and the risk embedded in more adverse oil price scenarios.
Stock Market Rebounds Don’t Require “Problem Resolution”, Only “Peak Shock”
In crisis scenarios, the strongest rebounds in the market often come from the narrowing of tail-end downside risks, not from full resolution of the crisis. As seen with COVID-19 and the tariff shocks, stock markets tended to bottom before the real economy hit its worst point—the stock market’s forward-looking nature outperforms the physical economy.
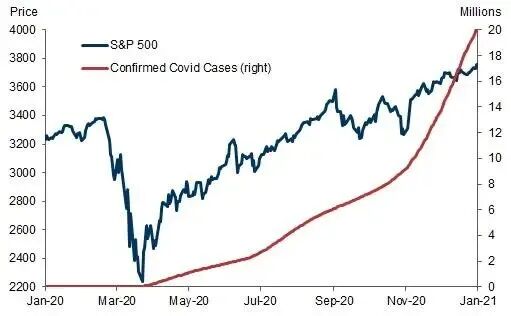
During the COVID pandemic, the S&P 500 bottomed and rebounded far before the major surge in confirmed cases. Last year, U.S. stocks also rebounded before most effective tariff rates rose.
At a price-to-earnings ratio of 25 times, even if the S&P 500’s annual profit is fully written off, the market would only fall by 4%. This means that, even with real economic damage ahead, the stock market usually only needs to see the limits of the shock for a bottom to form—a “fuzzy resolution path” can still trigger a rebound.
The most direct trigger would be some form of de-escalation of the conflict, even if supply disruption risks persist. In most scenarios, oil prices structurally remain above pre-war levels, and the terms of trade shock can only be partially reversed.
Cross-Asset Allocation: Three Axes Determine Benefiting Assets
The cross-asset allocation framework mainly focuses on three axes: assets that benefit from a narrowing of cyclical tail risks, assets that benefit from improved terms of trade, and assets that benefit from policy easing.
In easing scenarios, both rates and stocks will rebound in tandem, volatility will fall sharply, and the dollar will weaken. Versus option-implied volatility, U.S. and European stocks, credit, European currencies (including CEE-3 currencies), and U.S. Treasuries offer the best long positions. Also, Korean and Japanese stocks and some U.S. cyclical sectors, because of sharp declines, have meaningful rebound potential; if policy easing signals become clear, rate-sensitive sectors like homebuilders may outperform, and gold also has upside potential.
In the medium term, assets benefiting from improved terms of trade are preferred, including U.K., Australia, and Brazil equities, the Brazilian real, Australian dollar, Mexican peso, as well as copper and gold.
In more adverse scenarios, European assets (stocks, FX, and credit) still have relative hedging value in most downside scenarios; if the market shifts towards broader recession worries, the yen will strengthen, low-yield positions are more attractive, and the Australian and Canadian dollars as well as some high-yield emerging market currencies will be used to hedge the dollar and yen, while copper faces greater downside risk.
Cross-Scenario Consensus: Bonds See a “Smile Curve”, Low Long-Term Equity Volatility
Across all scenario paths, two judgments are relatively common and are not dependent on a specific crisis resolution.
First, interest rates exhibit a “smile curve” structure. Whether it’s hawkish repricing rollback in a calming scenario, or growth panic in a deep recession scenario, bonds—especially G10 front-end rates—and the yen all stand to benefit. This means bond yields may fall in various outcomes.
Second, long-term equity volatility and credit spreads may structurally rise. In most forecast paths, including the baseline, long-term equity volatility will continue to tick upwards, and credit spreads will widen.
In terms of tail-risk hedging, European assets perform relatively well in both upside and downside scenarios; in deeper downside scenarios, shorting cyclical currencies (such as AUD and CAD) versus the dollar and yen is also more attractive.
~~~~~~~~~~~~~~~~~~~~~~~~

Disclaimer: The content of this article solely reflects the author's opinion and does not represent the platform in any capacity. This article is not intended to serve as a reference for making investment decisions.
You may also like
ORCA (ORCA) fluctuates 41.7% in 24 hours: Solana DEX trading volume surge drives short squeeze and momentum rebound
MEGA (MegaETH) fluctuates 1333.3% in 24 hours: Token listed on multiple CEXs and mainnet incentive plan as drivers
TD Securities: Gold Prices Expected to Surpass $5,000 by the End of 2026

TAC (TACProtocol) fluctuated 69.6% in 24 hours: trading volume surged 236%, triggering a speculative rebound