
BNB price breaks out of multi-year falling wedge, eyes rally above $1,000

BNB price has broken out of a falling wedge pattern, which positions it for significant upside over the coming weeks.
- BNB price broke out of a falling wedge pattern, signaling a potential trend reversal, with price hovering near $620 after a 30% drop from its January high.
- Technical indicators, including a bullish MACD crossover, point to strengthening momentum, with a potential upside target near $1,089 if the breakout holds.
- Upcoming catalysts such as a $1.22 billion token burn, potential spot ETF filings, and Binance ecosystem activity could support further recovery.
According to data, BNB price was hovering around $620 last check on Wednesday, April 15. The token has fallen nearly 9% over the past month and over 30% from its year-to-date high of $949 reached on Jan. 15.
BNB’s price retreat was primarily triggered by a structural inversion in market liquidity, where Bitcoin’s dominance surged to 58.5% and drained capital from top-tier altcoins. This sell-off was intensified by a series of high-leverage long liquidations exceeding $2 billion in early February after BNB breached the critical $700 and $650 support zones, triggering mass stop-loss orders.
While the token’s price still remains relatively suppressed compared to earlier this year, a look at the technical charts reveals a highly optimistic setup for a trend reversal.
On the daily chart, BNB price has broken out of a falling wedge pattern formed of two descending and converging trendlines. When an asset breaks out from such a formation, it often signals a powerful move toward the upside as selling pressure exhausts.
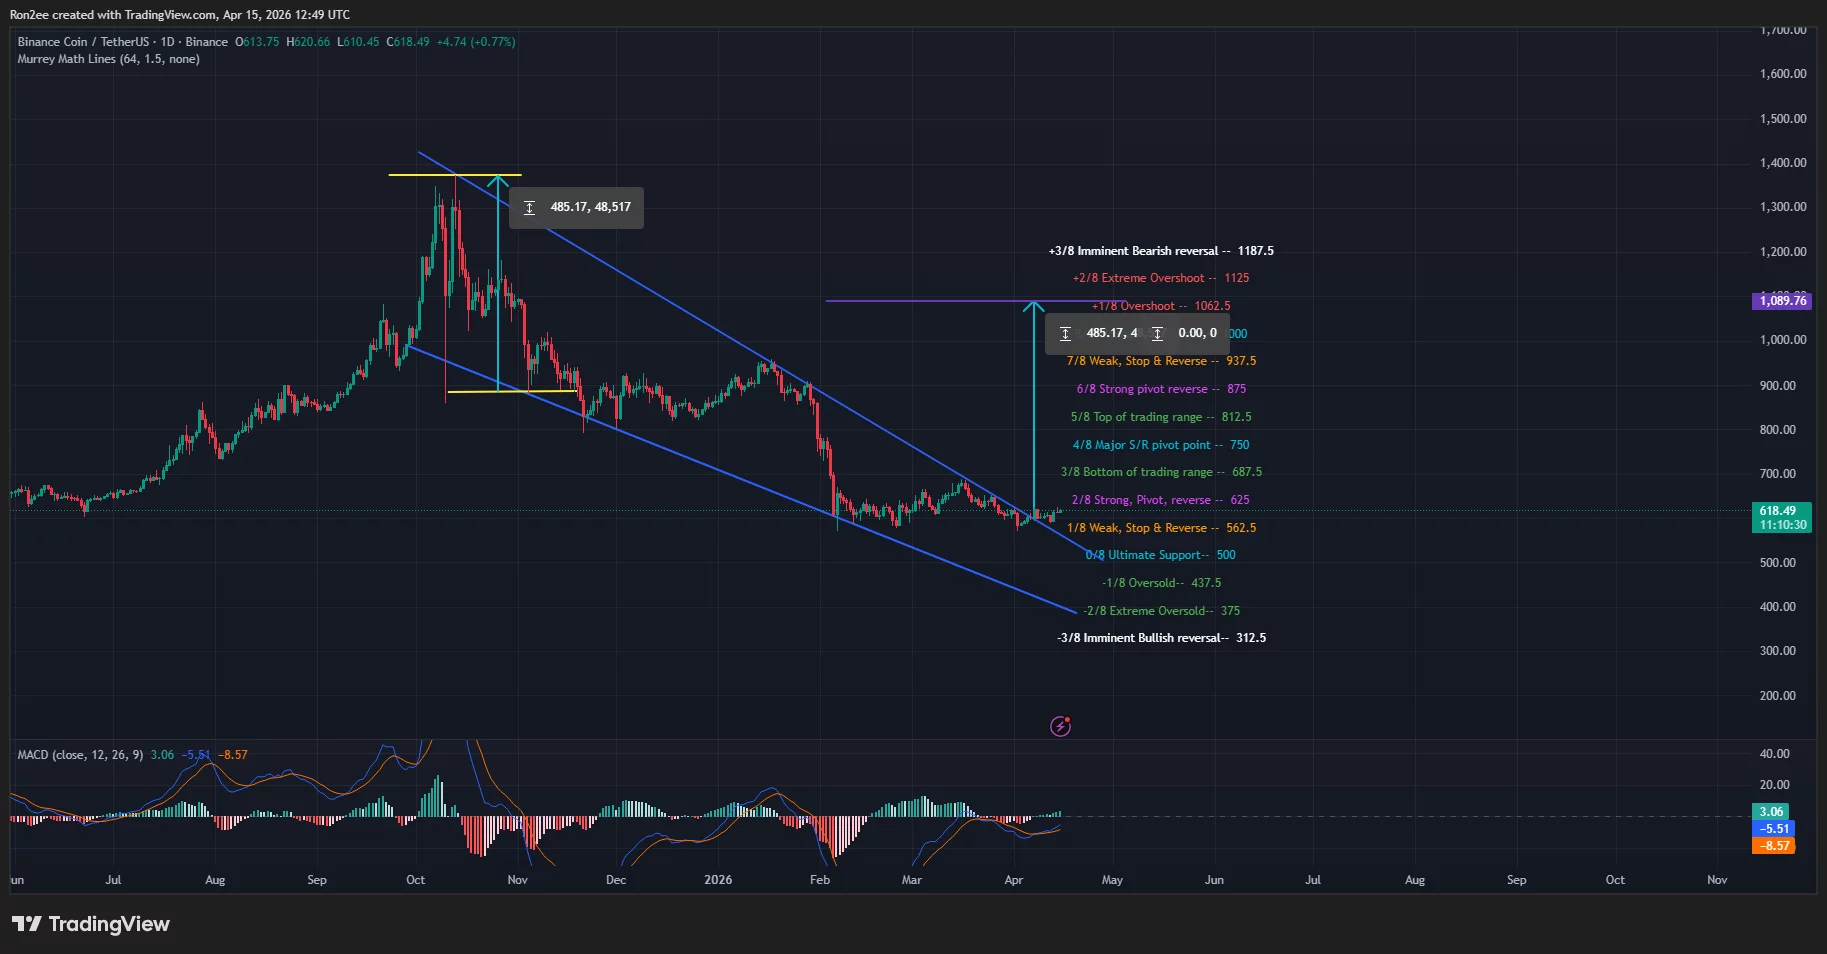 BNB price has broken out of a falling wedge pattern on the daily chart — April 15 | Source:
As such, the breakout from the pattern suggests a potential rally to as high as $1,089, a level calculated by adding the height of the falling wedge pattern formed to the breakout point of the upper trendline.
The token is currently trading towards the strong pivot reverse of the Murrey Math line at $625. A break above this specific threshold would likely accelerate the buying momentum and clear the path for a retest of previous psychological resistance zones.
Furthermore, the MACD lines have formed a bullish crossover, which means the short term momentum is beginning to outweigh the long term selling trend and typically indicates that a sustained price increase is underway.
Bullish catalysts for BNB
BNB token has multiple catalysts in the background that could support a potential recovery in the coming weeks.
First, the BNB ecosystem is expected to announce its next quarterly burn soon. As per reports, nearly 1.36 million BNB worth around $1.22 billion would be permanently removed from circulation and hence create a supply shock that historically leads to price appreciation.
Second, institutional investors such as VanEck and Grayscale are currently pursuing spot BNB ETF applications. If the SEC shows any progress on the approval of these filings, it could unlock massive institutional capital inflows and provide a major stamp of legitimacy for the asset.
Third, high-profile listings on Binance, the world’s largest exchange, such as Genius, which was listed on April 13, continue to drive engagement and demand within the ecosystem by encouraging users to hold and use BNB for participation in various launchpools and trading activities.
Disclaimer: The content of this article solely reflects the author's opinion and does not represent the platform in any capacity. This article is not intended to serve as a reference for making investment decisions.
You may also like
AUD/JPY Hits Highest Level in 36 Years – Why There’s More Behind It Than Just Carry Trade
Zoomex Launches ZoomexStocks: Trade Global Equities with USDT + Limited-Time Fee Rebate Campaign
DeFi Protocols Lead the Charge – Analyzing Today’s Top Crypto Gainers and Market Sentiment
Eurozone: Downside risks for industry grow after war shock – ING