

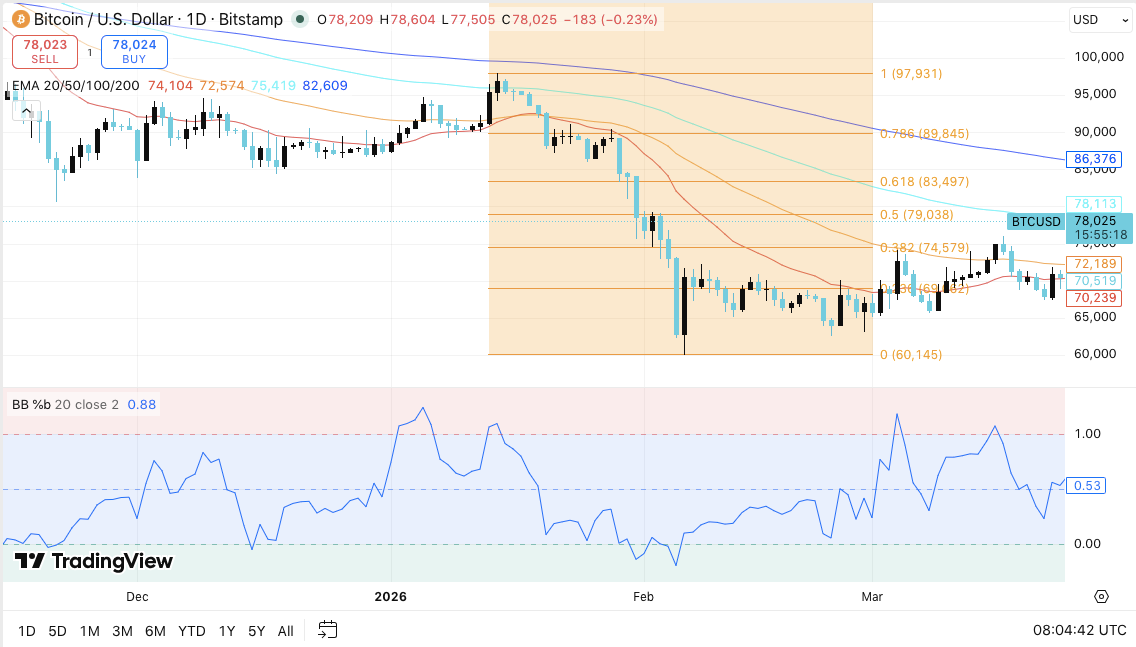
Bitcoin continues to stabilize after a steep correction, as price action shifts from a clear downtrend into a tight consolidation range. The daily chart now reflects a market searching for direction, with buyers attempting to absorb supply while sellers defend key resistance zones.
Although volatility has cooled, the broader structure still leans cautious, especially as price remains capped below major technical levels. Consequently, traders now watch whether accumulation can transition into a sustained recovery or fade into another leg lower.
Bitcoin trades within a narrow band between roughly $74,000 and $78,000. This compression follows a sharp decline from near $97,000 toward the $60,000 region. Moreover, the formation of lower highs continues to reflect lingering bearish pressure.
Key Fibonacci levels define the current battlefield. Immediate resistance sits near $78,100–$78,600, where price recently faced rejection. Beyond that, the $83,500 level, aligned with the 0.618 retracement, stands as the most critical barrier. A break above this zone could shift sentiment decisively.
 Bitcoin Price Dynamics (Source: Trading View)
On the downside, support at $74,500 remains under pressure. Additionally, the $70,500–$72,000 region provides stronger structural backing due to moving average confluence. If price loses this zone, downside risk toward $60,000 increases significantly.
Technical indicators reinforce the current neutral-to-bearish outlook. Price continues to trade below major moving averages, signaling that sellers still control the broader trend. Notably, the 200-day EMA near $82,000 acts as dynamic resistance.
Related: Ethereum Price Prediction: ETH Faces Range Pressure as Bulls Eye $2,500 Breakout Zone
Meanwhile, Bollinger %B hovers near mid-range levels, indicating balanced momentum. This aligns with the ongoing consolidation phase. Hence, the market lacks a strong directional catalyst in the short term.
 Source:
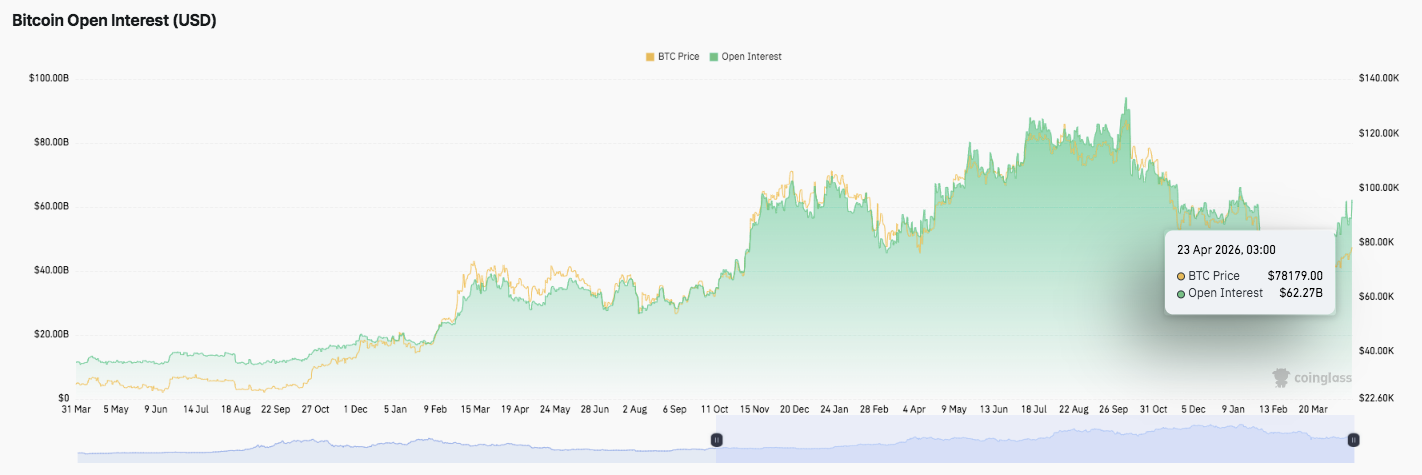
Beyond price action, derivatives data offers additional insight. Open interest recently cooled from overheated levels near $90 billion to around $62 billion. However, this decline reflects healthy deleveraging rather than structural weakness.
Significantly, open interest has started to rebound alongside price stability. This suggests traders are cautiously re-entering the market. Resistance stands near $70 billion and $80 billion, while $60 billion remains key support.
 Source:
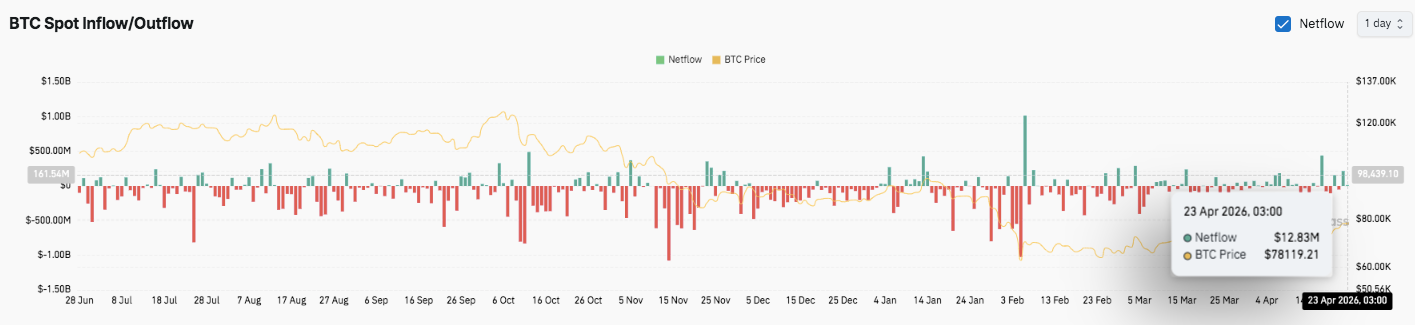
Spot flows further support this view. Earlier heavy outflows have eased, and inflows now appear more consistent. Moreover, recent positive netflows indicate that buyers continue to absorb available supply.
Related: XRP Price Prediction: Cup And Handle Projects $1.70 As XRP Posts Strongest ETF Week In 2026
Key levels remain clearly defined as Bitcoin trades within a tightening consolidation range following its recent correction. Price continues to react around major Fibonacci zones, while momentum remains subdued below key moving averages.
Upside levels: $78,100–$78,600 stands as the immediate hurdle. A breakout could open the path toward $83,500 (0.618 Fib). Further strength may extend gains toward $89,800 and eventually the $97,900 macro high.
Downside levels: $74,500 serves as immediate support under pressure. Below that, the $70,500–$72,000 zone remains critical for structure. A breakdown here could expose Bitcoin to $65,000 and the $60,100 demand zone.
Resistance ceiling: The $82,000 region, aligned with the 200-day EMA, remains the key level to flip for a sustained bullish shift.
The technical structure suggests Bitcoin is compressing inside a horizontal accumulation range. This setup often precedes volatility expansion, especially after a sharp directional move.
Bitcoin’s short-term outlook depends on whether buyers can defend the $72,000–$74,500 support cluster. Holding this zone could allow another attempt at reclaiming $78,000 and challenging the $83,500 resistance. Moreover, improving spot inflows and stabilizing open interest support a cautiously constructive bias.
However, failure to hold support may trigger renewed selling pressure. A drop below $70,000 would likely accelerate downside momentum toward $60,000.
For now, Bitcoin remains at a pivotal inflection point. Compression continues to build, and a decisive breakout will likely define the next major trend.
Related: Spark Price Prediction: SPK Surges 78% as Price Eyes $0.070 After Breakout