
AMD Weekly | 260 Breakout | Perfect Lesson in Support Resistance

By:TradingView
Bitget offers one-stop trading for cryptocurrencies, stocks, and gold. Trade now!
A welcome pack worth 6200 USDT for new users! Sign up now!
Hello TradingView Community, Hope you enjoyed your weekend. 👋
Sharing a clean and educational weekly chart study on AMD, where price action around the 260 resistance level is doing an excellent job of explaining how markets respect support and resistance over time. While this idea focuses on a potential long opportunity after a confirmed breakout, it also serves as a strong example of market structure, retests, and consolidation behavior that every trader can learn from.
This is a long-side trading idea based on the weekly chart of Advanced Micro Devices (AMD), with the primary focus on a potential breakout above the 260 resistance level. A strong weekly close and sustained price acceptance above this zone could confirm bullish continuation, supported by a classic measured move projection.
That said, even without an actual breakout, this chart itself is extremely valuable from a learning and market structure perspective. It beautifully demonstrates some of the most important and timeless principles of technical analysis-:
+How major resistance levels repeatedly act as supply zones.
+Why price often reacts sharply near key resistance.
+How a successful breakout can transform resistance into support.
+The importance of a proper retest before continuation.
+How consolidation near resistance often signals institutional participation.
The price action over multiple years clearly highlights that markets move in phases expansion, correction, consolidation, and continuation all guided by support and resistance behavior. This makes the chart useful not only for traders looking for opportunities, but also for those aiming to improve their chart reading and decision-making skills.
Key Resistance / Closing basis: 260
Directional Bias: Bullish only after a confirmed breakout
Measured Target: 325 To 330
Risk Note: Invalidation on a weekly close back below 260
Note-:In case of strong bullish continuation, the rising resistance trendline comes into focus as a secondary target area, currently placed near the 400 level, That's why rising resistance placed on provided chart
Patience and confirmation remain critical, especially on higher timeframes.
Regards- Amit.
0
0
Disclaimer: The content of this article solely reflects the author's opinion and does not represent the platform in any capacity. This article is not intended to serve as a reference for making investment decisions.
Understand the market, then trade.
Bitget offers one-stop trading for cryptocurrencies, stocks, and gold.
Trade now!
You may also like
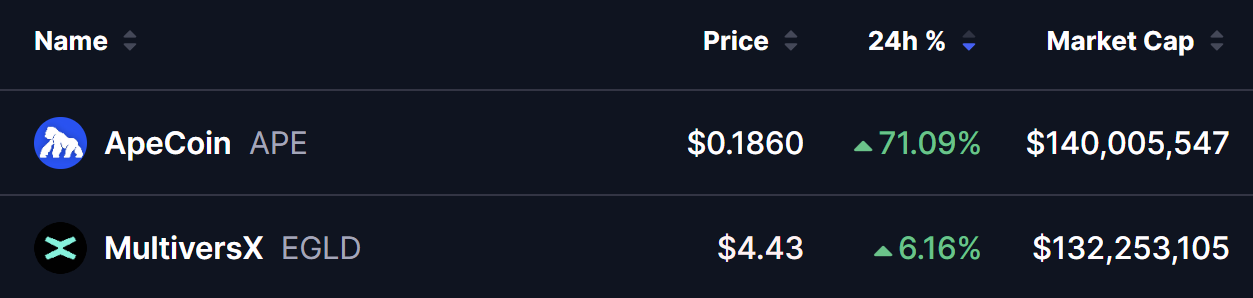
Missed the APE Rally? This MultiversX (EGLD) Setup Could Trigger the Next Bullish Move
Coinsprobe•2026/04/25 07:06
SHIB Nears Breakout Point After Revisiting Powerful Support Level
Cryptonewsland•2026/04/25 06:42

UK cracks down on illegal peer-to-peer crypto trading in nationwide raids
Cointime•2026/04/25 06:22

XRP Price: What Bulls Need To Reclaim $2.90 And What Bears Must Break
Newsbtc•2026/04/25 06:09

Trending news
MoreCrypto prices
MoreBitcoin
BTC
$77,487.93
-0.48%
Ethereum
ETH
$2,315.03
+0.06%
Tether USDt
USDT
$1
-0.02%
XRP
XRP
$1.43
+0.02%
BNB
BNB
$637.52
+0.32%
USDC
USDC
$0.9997
-0.02%
Solana
SOL
$86.36
+0.96%
TRON
TRX
$0.3238
-1.17%
Dogecoin
DOGE
$0.09838
+0.72%
Hyperliquid
HYPE
$41.21
-0.07%
How to buy BTC
Bitget lists BTC – Buy or sell BTC quickly on Bitget!
Trade now
Become a trader now?A welcome pack worth 6200 USDT for new users!
Sign up now