EUR/JPY Price Forecast: Slips below 184.50 near the confluence around descending wedge top

EUR/JPY continues its losing streak for the fourth successive day, trading around 184.40 during the European hours on Friday. The technical analysis of the daily chart indicates the currency cross is positioned slightly below the upper boundary of an emerging descending wedge pattern. The pattern shows lower highs and lower lows; the narrowing price range indicates that selling momentum is losing steam.
The EUR/JPY cross keeps a bearish near-term tone as it holds below both the nine-period and 50-period Exponential Moving Averages (EMAs), respectively. The currency cross has retreated from recent highs, and the 14-day Relative Strength Index (RSI) at 44.70 leans slightly to the downside, suggesting fading bullish momentum rather than an oversold condition.
The EUR/JPY cross may test the immediate barrier at the nine-day EMA of 184.78, followed by the 50-day EMA at 184.87 and the upper boundary of the descending wedge. A successful break above the confluence resistance zone around the wedge would support the EUR/JPY cross to explore the region around the all-time high of 187.95, which was recorded on April 17.
On the downside, the EUR/JPY cross may navigate the region around the 12-week low of 181.87, recorded on March 16, followed by a five-month low of 180.81, which was reached on February 12.
(The technical analysis of this story was written with the help of an AI tool.)
Disclaimer: The content of this article solely reflects the author's opinion and does not represent the platform in any capacity. This article is not intended to serve as a reference for making investment decisions.
You may also like
Cardano’s long-term structure is changing – How whales played a part

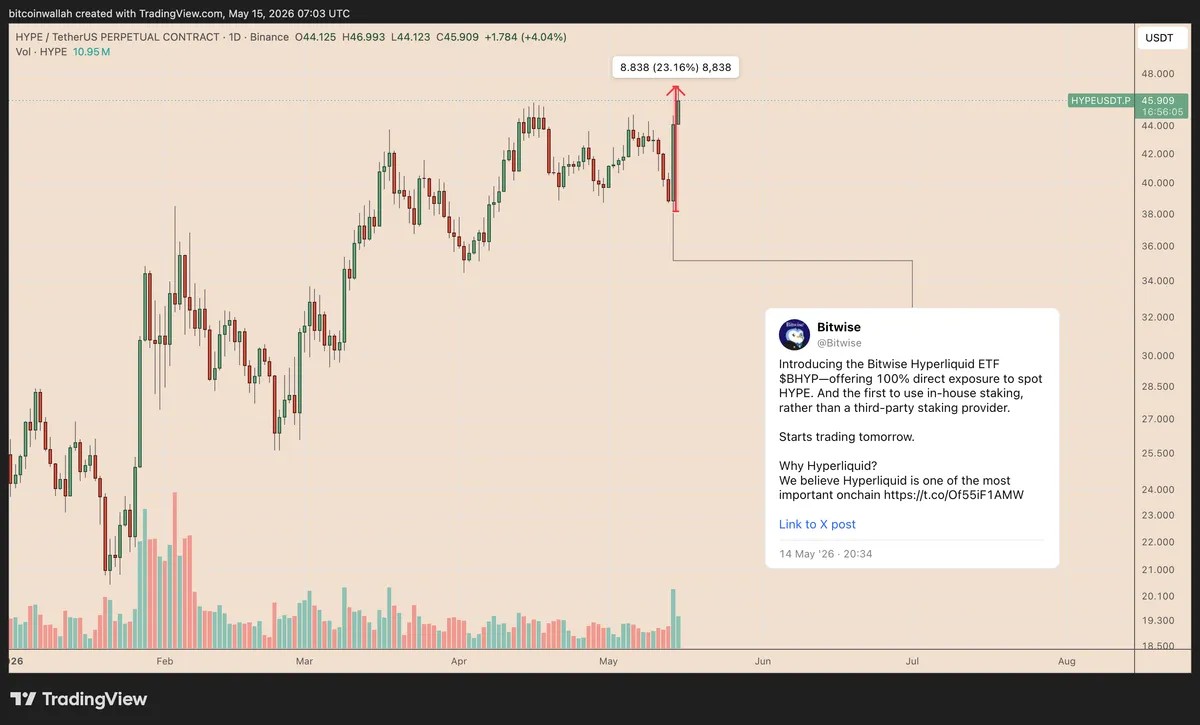
Hyperliquid Token Price Jumps 23% in a Day: Can The Bullish 'HYPE' Sustain?
XRP Looks Strong for a $17 Bull Run, Could Challenge Ethereum — Financial Analyst

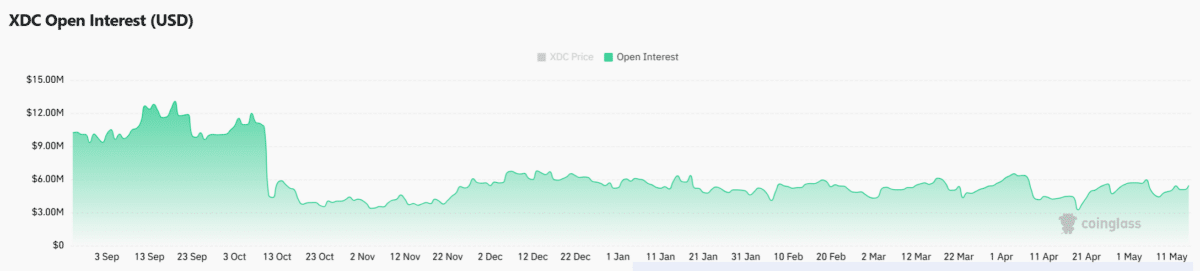
XDC surges 13% as traders pile in – Can bulls crack $0.037 next?