XRP Just Fired a Major Signal that Led to Three Breakouts

A familiar technical pattern has returned for XRP. Crypto analyst ChartNerd (@ChartNerdTA) believes the latest move deserves close attention.
His newest chart compares several market cycles and identifies a recurring signal near the lower regression band of the Gaussian Channel. He argues the same behavior has appeared before and has now emerged again in 2026.
One of our $XRP signals just fired! 👏
Price has returned home to the lower regression band of the Gaussian Channel on the 2W timeframe ($1.04). This behaviour consistently repeated during prior cycles and we mapped it again in 2026.
Welcome to the land of macro opportunity 🥂
— 🇬🇧 ChartNerd 📊 (@ChartNerdTA) June 12, 2026
XRP’s Repeating Technical Signal
ChartNerd told followers that one of his XRP signals had fired after the price returned to the lower regression band of the Gaussian Channel on the two-week chart at $1.04. He noted that this Gaussian Channel retest has “consistently repeated during prior cycles” and added that it has now been mapped again in 2026. He welcomed followers to the “land of macro opportunity.”
The chart compares several periods dating back to 2014 and key areas in 2017, 2020, and 2023 before extending the pattern into 2026. Each highlighted zone appears close to the lower Gaussian Channel, while arrows labeled “Bear Market” point toward those areas.
Every time the bear market pushed XRP into the lower regression band, it experienced a swift rebound. This move created the cycle peak in 2018, $1.96 in 2021, and the 500% rally in late 2024.
Is XRP Only Going Up From Here?
One community member asked whether the latest setup could mean XRP begins an upward move immediately, in a final sweep below $1, which ChartNerd previously predicted. The analyst warned that investors should avoid focusing all their attention on identifying the exact bottom.
He still expects XRP to reach $0.90 or $0.70 in 2026. At the same time, he noted that more lower macro time period signals are appearing around areas that matched previous historical cycle lows, making a potential bottom between now and Q4 increasingly worth watching.
A Long-Term Opportunity
Rather than presenting an immediate upside target, the chart emphasizes the return to a level that ChartNerd associates with past cycle lows. XRP experienced a sharp decline in early June that pushed it toward the lower regression band.
While some may see this as temporary volatility, ChartNerd sees the bigger picture. This pattern has been building for a long time, and XRP has now hit the crucial level. He isn’t looking for a short-term relief rally but an explosive move similar to previous cycles.
Disclaimer: The content of this article solely reflects the author's opinion and does not represent the platform in any capacity. This article is not intended to serve as a reference for making investment decisions.
You may also like
TAO Price Surges 21% After Anthropic Restrictions Spark Decentralized AI Debate

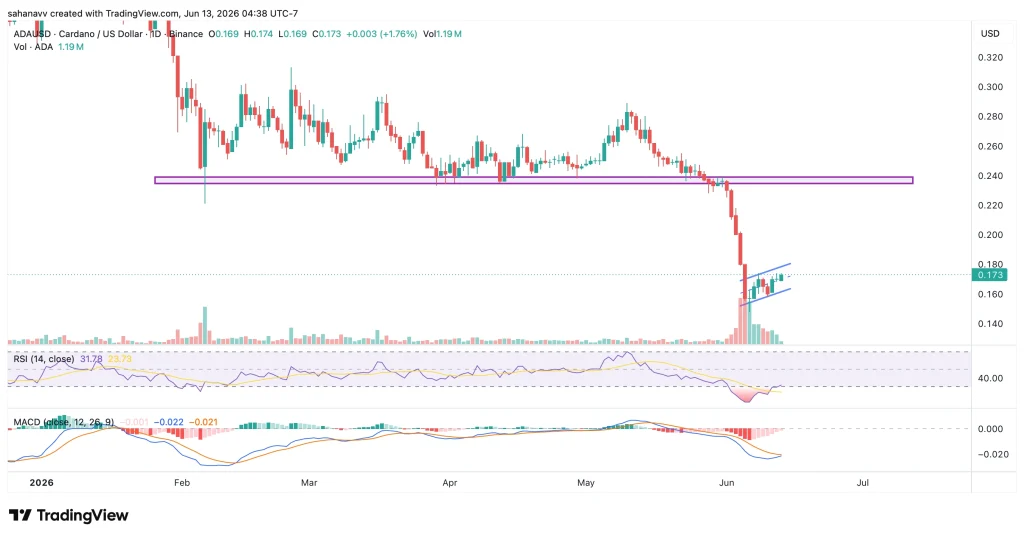
Cardano (ADA) Price Rebounds, but This One Resistance Could Trigger a 35% Recovery
Is RENDER Price Setting Up For A Bigger Breakout?