- Hedera ($HBAR) price is currently consolidating in a tight range.
- A falling wedge pattern is forming on the 15-minute chart.
- A confirmed move above the wedge resistance zone near $0.0815 would signal a rebound.
Hedera ($HBAR) has been trading in a narrow range, with price action showing repeated compression around key short-term levels.
At the time of writing, $HBAR was trading at $0.0801, moving within a 24-hour range of $0.07801 to $0.0803.
The market has shown minimal directional strength today, with a 24-hour change of +0.1%, reflecting near-flat momentum.
While the token has seen a mild gain today, it continues to show weakness across longer timeframes.
$HBAR is down 2.4% over the past 7 days, 6.7% over the past 30 days, and approximately 39.9% over the past year.
This extended decline places current price action in a longer consolidation phase rather than a sustained recovery trend.
Tight consolidation dominates short-term structure
Looking at the charts, the lower boundary around $0.0780 has acted as consistent support, while upside movement has been capped near $0.0803–$0.0810.
This compressed structure has resulted in a tightly controlled trading environment where volatility is declining.
Each minor rebound has been followed by rejection at nearby resistance, while dips continue to attract buyers at similar levels.
The result is a market that is neither trending upward nor breaking down decisively, but instead moving sideways in a constrained channel.
Falling wedge formation
On lower timeframes, particularly the 15-minute chart, $HBAR is forming a clearly defined falling wedge pattern.
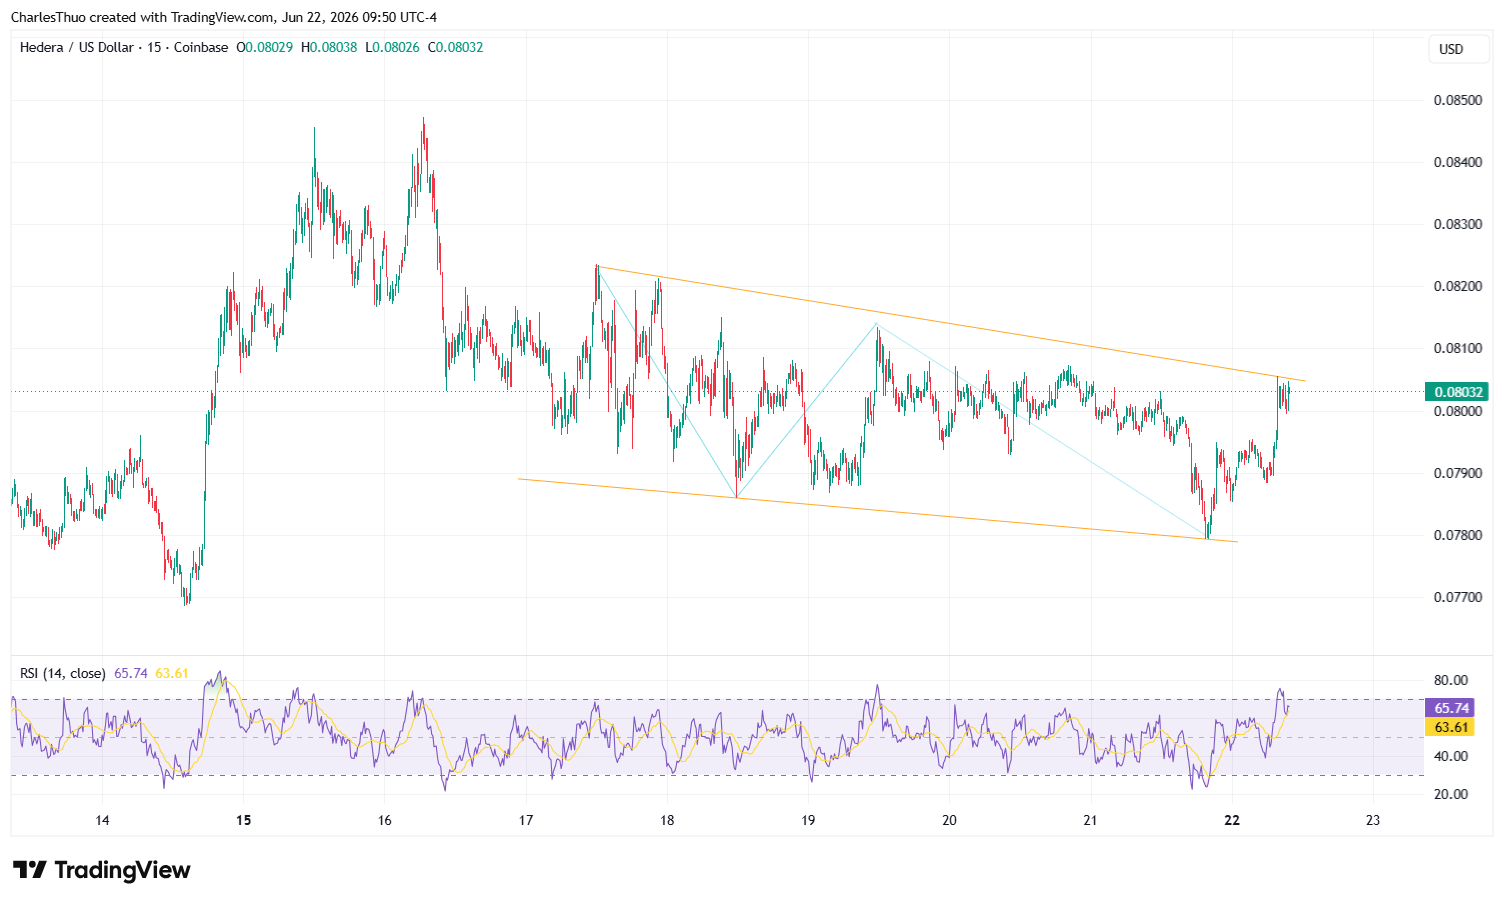
The pattern is characterised by two downward-sloping trendlines that converge as price action tightens.
The lower boundary of this wedge sits near $0.0780, a level that has been tested multiple times without a breakdown.
Each retest has produced short rebounds, indicating that selling pressure is gradually weakening at this zone.
The upper boundary of the wedge is positioned around $0.0805 to $0.0815, where repeated rejection has occurred.
The price is gradually compressing toward the apex of this structure, a phase often associated with directional expansion once a breakout occurs.
Hedera price forecast
The current technical framework places clear importance on two primary levels.
On the upside, a confirmed move above the wedge resistance zone near $0.0815 would represent the first sign of a bullish rebound.
If followed by sustained momentum, short-term projections indicate a move toward $0.0830, with extended targets around $0.0840 to $0.0850.
On the downside, a breakdown below $0.0780 would invalidate the current wedge structure.
Such a move would expose lower liquidity zones and extend the existing bearish consolidation phase.
However, at present, price remains positioned almost exactly between these two thresholds, reinforcing the compression narrative.