

 thecryptobasic.com
The $XRP price bottom for the ongoing downtrend now depends on whether the crypto asset is following an expanded, running, or regular flat.
$XRP has remained under selling pressure since reaching its all-time high of $3.66 in July 2025. Since then, the asset has lost around 70% of its value and is currently trading near $1.08.
As the decline enters its eleventh month, Elliott Wave analysis suggests that $XRP may still be moving through a flat correction. Notably, the specific type of flat pattern could determine how much further the asset may fall before finding a bottom.
$XRP Correction Following Flat Pattern
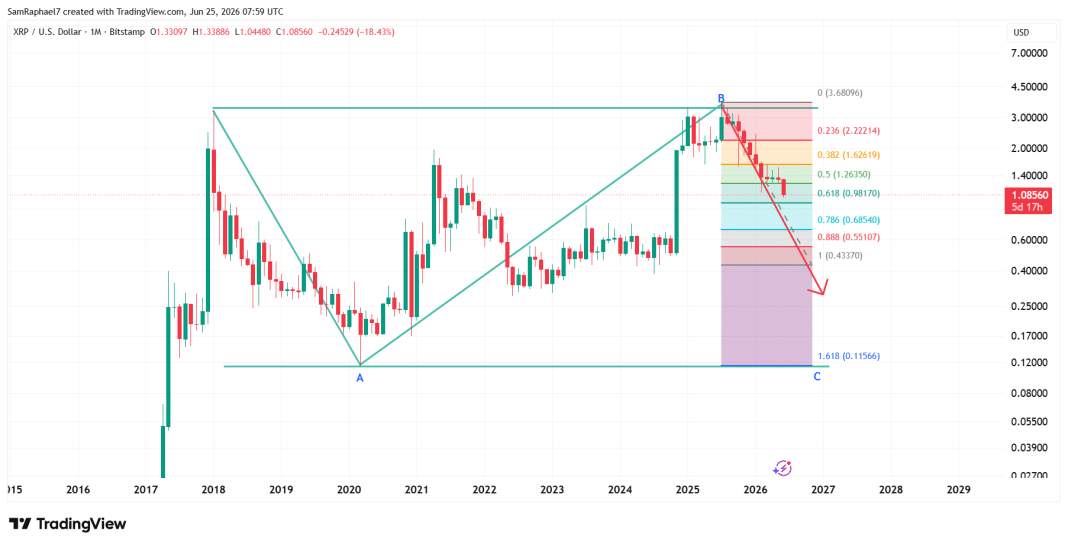
Under Elliott Wave theory, flat corrections develop in Waves A, B, and C. $XRP’s price history over the past several years seems to follow this structure.
Specifically, Wave A began after $XRP peaked at $3.31 in January 2018. During the prolonged bear market that followed, the price crashed and eventually reached a low of about $0.11 in March 2020, marking a decline of roughly 97%.
Wave B then reversed the pullback. The recovery erased the earlier losses and also pushed $XRP to a new all-time high of $3.66 in July 2025. Considering this, data suggests $XRP could now be following one of three flat structures: a regular flat, an expanded flat, or a running flat.
 $XRP Flat Structure
Wave C started after the July 2025 peak and has continued to weigh on price action. So far, $XRP has recorded losses in eight of the last ten completed months. June 2026 is also on track to end in negative territory, with the token already down about 18% for the month.
Regular Flat May Be the Least Likely Pattern
In a regular flat, Wave B usually returns close to the starting point of Wave A but does not move significantly above it. Wave C then typically ends near the low established during Wave A.
$XRP’s price action does not fit this. Notably, Wave B climbed beyond the $3.31 starting point of Wave A and reached a new all-time high at $3.66. Such a strong move goes against the typical features of a regular flat.
If $XRP were still following a regular flat, the correction would likely end near the previous low around $0.11. However, because Wave B moved so far above the earlier high, this scenario is the least convincing of the three.
$XRP Price Action Aligning with Expanded Flat
Currently, the expanded flat appears to match $XRP’s structure better than the other alternatives.
For context, this type of flat requires Wave B to rise above the origin of Wave A, which $XRP already achieved by reaching $3.66. It also expects Wave C to move below the low of Wave A and establish a new downside extreme.
However, applying the standard 1.618 Fibonacci extension correction for an expanded flat would push $XRP’s price almost below zero. This is analytically improbable for an asset with such established market depth.
As a result, a less aggressive Fibonacci 1.0 projection works better in this case, and presents $0.46 as a possible target if $XRP continues to follow the expanded flat pattern.
Running Flat Still Cannot Be Ruled Out
Meanwhile, the running flat remains another possibility. Like the expanded flat, a running flat allows Wave B to move above the starting point of Wave A. The major difference is that Wave C does not fall below the Wave A low. Instead, it bottoms above that level before the broader uptrend resumes.
If $XRP is following a running flat, the correction could end somewhere between $0.50 and $0.80. Interestingly, the $0.80 level aligns with projections from analysts like Casi and Chart Nerd for $XRP’s bottom.
However, current market conditions make the running flat less convincing. $XRP has suffered nearly continuous monthly losses for almost a year, and the scale of the decline suggests strong bearish momentum.
Running flats usually show more underlying strength than what $XRP has displayed so far. Despite this, the running flat remains valid as long as $XRP stays above $0.11. A confirmed break below that level would remove this scenario entirely.
Overall, an impulsive rally that pushes $XRP above its $3.66 all-time high and continues higher would invalidate the entire flat structure. Such a move would suggest that the current decline is part of a different and larger market pattern.
